Field Sales KPIs in Wholesale: The 3 Levels of Sales Management
Summary
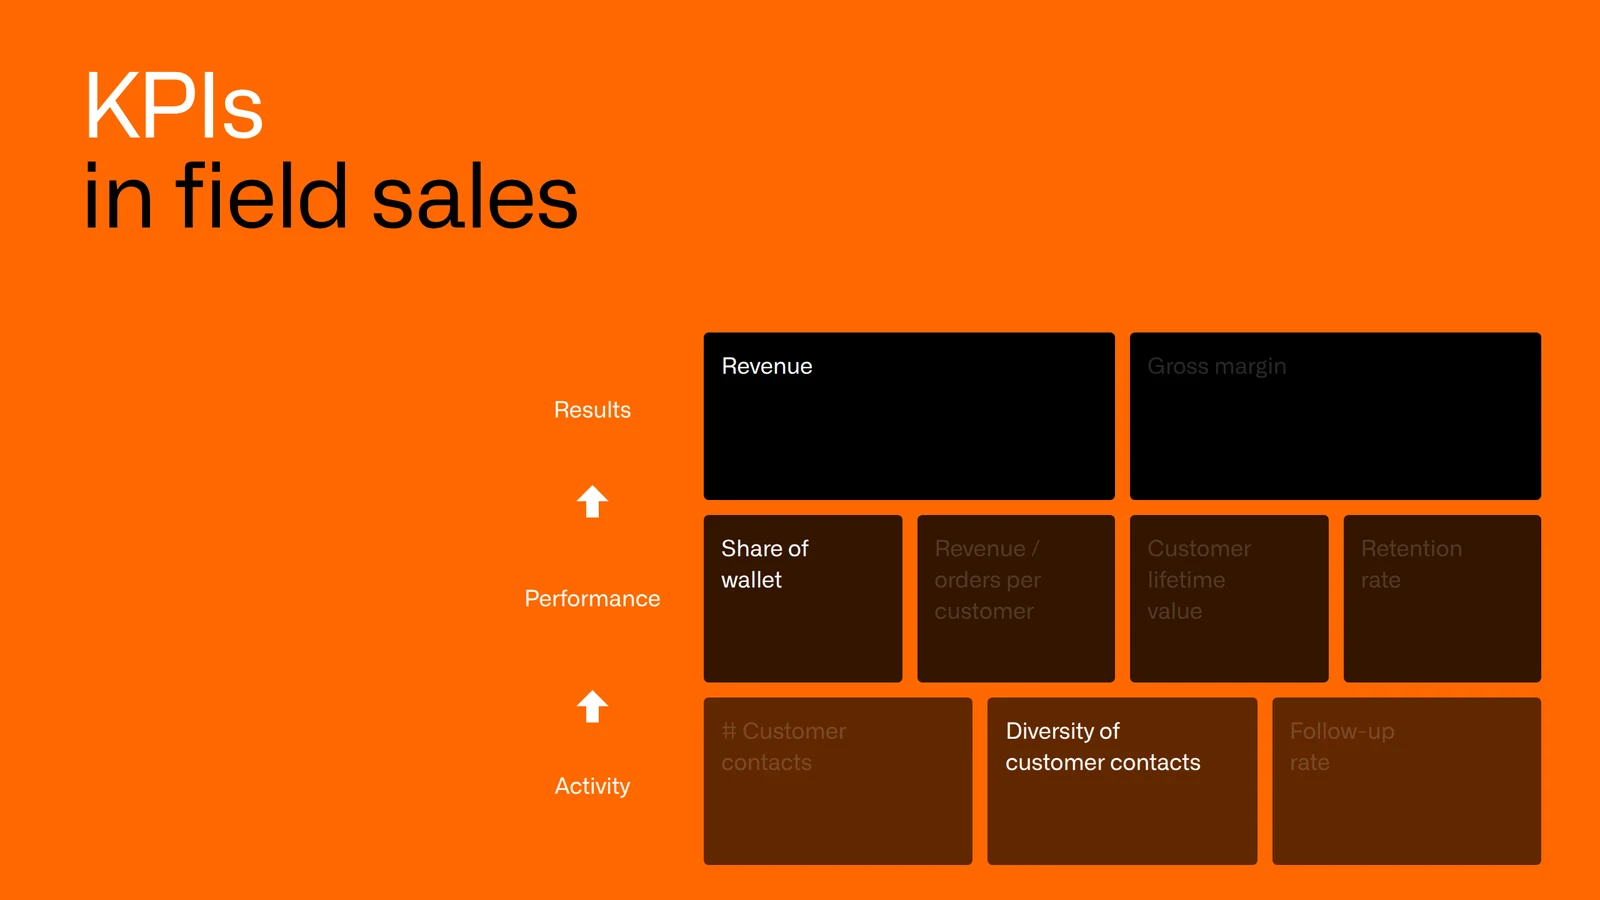
- Field sales KPIs work on three levels: activity, performance and results.
- Instead of only counting visits, wholesalers should track activity KPIs such as contact diversity and performance KPIs such as share of wallet.
- Leading indicators from ERP data, such as falling order frequency, show where to act before revenue drops.
For decades, field sales in wholesale has been judged by a number that says little about success: customer visits per week.
Reps who visit a lot are doing well. Reps who visit less have to explain themselves.
The problem is that visit frequency does not show whether the right customers were visited, whether the conversation led to an order, or whether an existing customer at risk of leaving was kept in time.
The pressure on sales teams is real. In Xactly's 2024 Sales Compensation Report, 91 percent of companies said they do not expect their account executives to meet or exceed quota. The RepVue Cloud Index, which tracks around 42,000 quota-carrying sellers at cloud software companies, put average quota attainment at 43.14 percent at the end of 2024. Both figures come from software sales rather than wholesale, but they point to the same pattern.
The cause is rarely that sales teams work too little. More often, they are measured on the wrong work.
This article shows how a three-level KPI framework changes that, and which field sales KPIs actually matter for wholesalers, distributors and manufacturers with direct sales.
1. Why most field sales KPIs are misleading
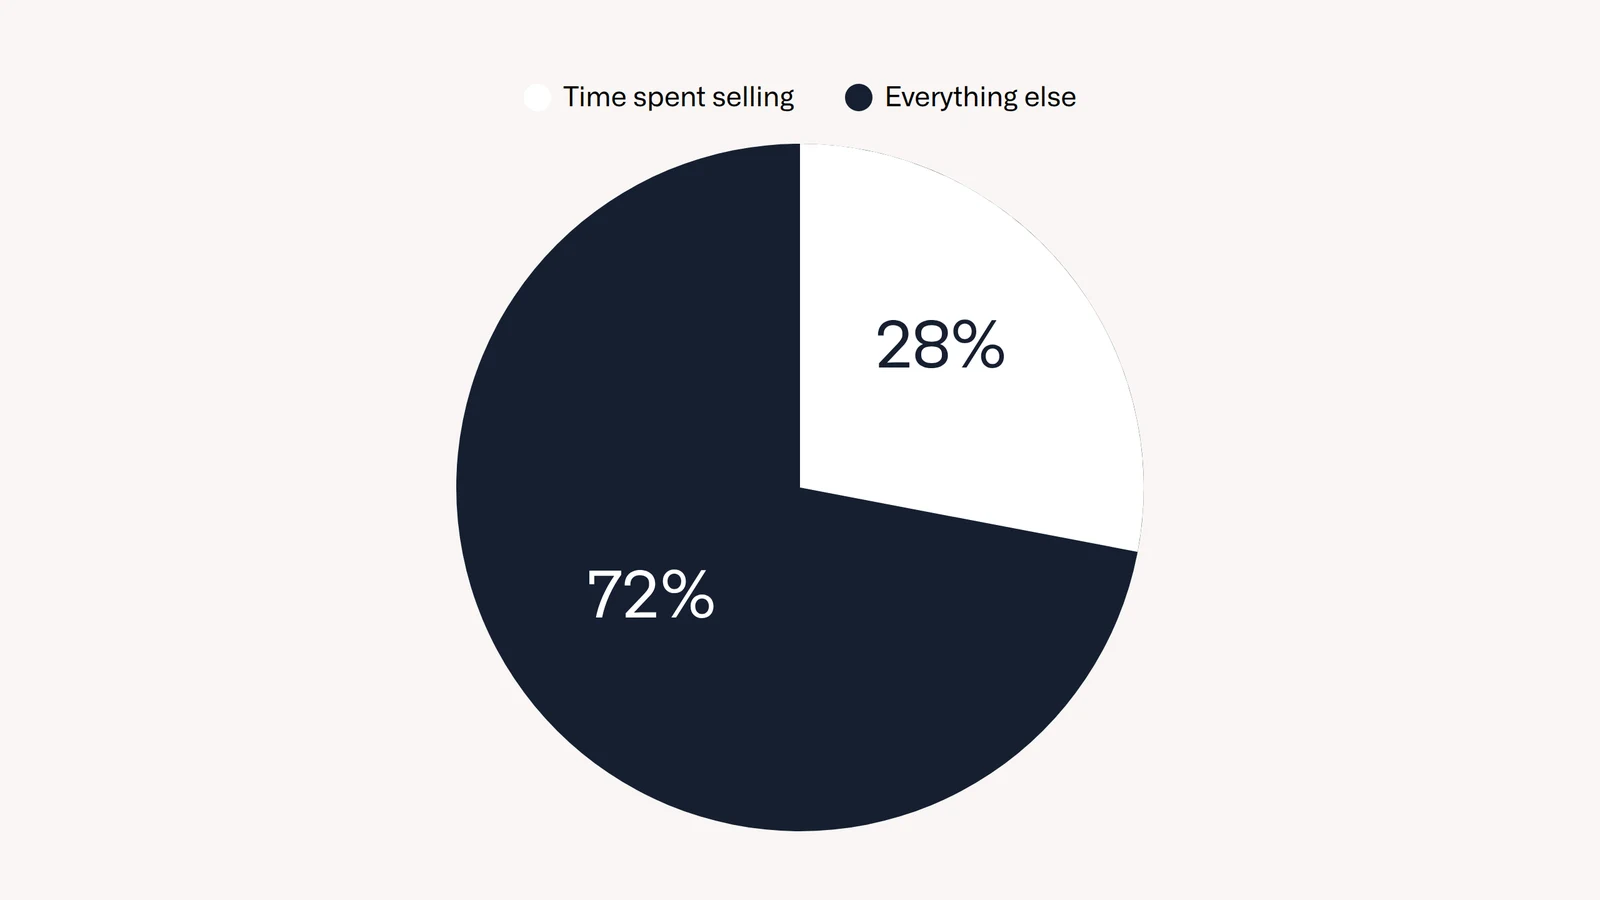
A field rep in wholesale typically looks after several hundred customers at once and spends a large part of the working day in the car. Across industries, Salesforce's State of Sales research found that reps spend just 28 percent of their week actually selling. The rest goes into deal management, data entry, admin and other tasks.
The classic KPI set measures exactly this non-selling time as well:
- How many visits were made?
- How many miles were driven?
- How many calls were logged?
These are activity metrics. They show how busy someone is, not what the work achieved.
The bigger problem runs deeper: activity metrics look backwards.
They show what happened yesterday, not what will happen tomorrow. Counting how many customers were visited tells you nothing about whether the right ones were among them. Knowing Q3 revenue tells you nothing about which customers might leave in Q4.
Wholesale sales that is meant to be steered needs three kinds of metrics, not one.
2. The three levels of field sales KPIs
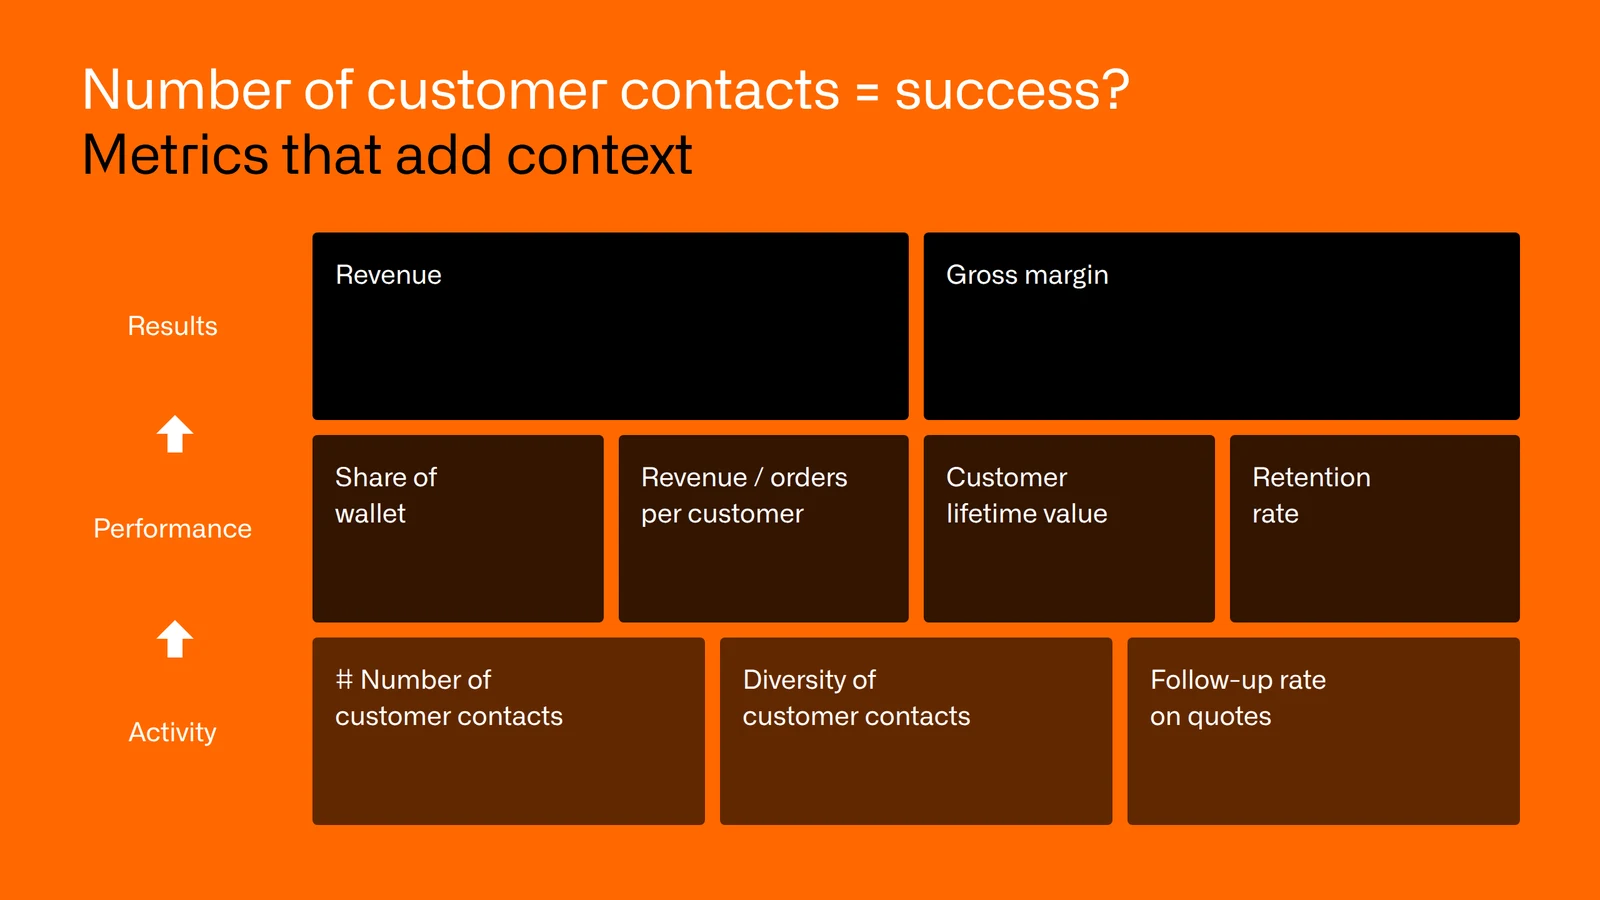
Example calculation: a rep with 7 visits a week and €15,000 in revenue per visit (€105,000) contributes more than a rep with 12 visits and €6,000 per visit (€72,000).
The basic formula for field sales performance is:
Revenue = number of visits × revenue per visit
If you want to grow revenue, you essentially have two levers: more visits or more revenue per visit. Good sales management looks at both at the same time.
2.1 Level 1: activity KPIs (what the field team does)
Activity KPIs measure input: how many visits, calls, quotes and emails? These numbers are necessary, but not sufficient on their own.
The number of customer contacts matters. Two additional activity KPIs add the context it lacks:
- Contact diversity: how many different customers did we reach? Or did we keep visiting the same A-accounts?
- Follow-up rate: are we writing quotes all day, or are we also following up on quotes that have not turned into orders yet? (See next best action for how open quotes become concrete tasks.)
2.2 Level 2: performance KPIs (where to steer next)
Performance KPIs measure output and show where to steer: revenue per visit, gross margin per visit, win rate, quote-to-order ratio, average order value.
This level is where reactive and proactive sales management part ways.
Every activity has to pay into these KPIs in the end. They let you dig deeper and understand where the current approach is not working, and they are the basis for redirecting activities in a targeted way.
Two examples:
- Share of wallet: how much of our range does this customer already buy from us? Do we have an upselling problem, or should we focus elsewhere? More on this: upselling in wholesale.
- Retention rate: how well do we keep existing customers? Do we notice declining orders early enough to react? More on this: how to prevent customer churn.
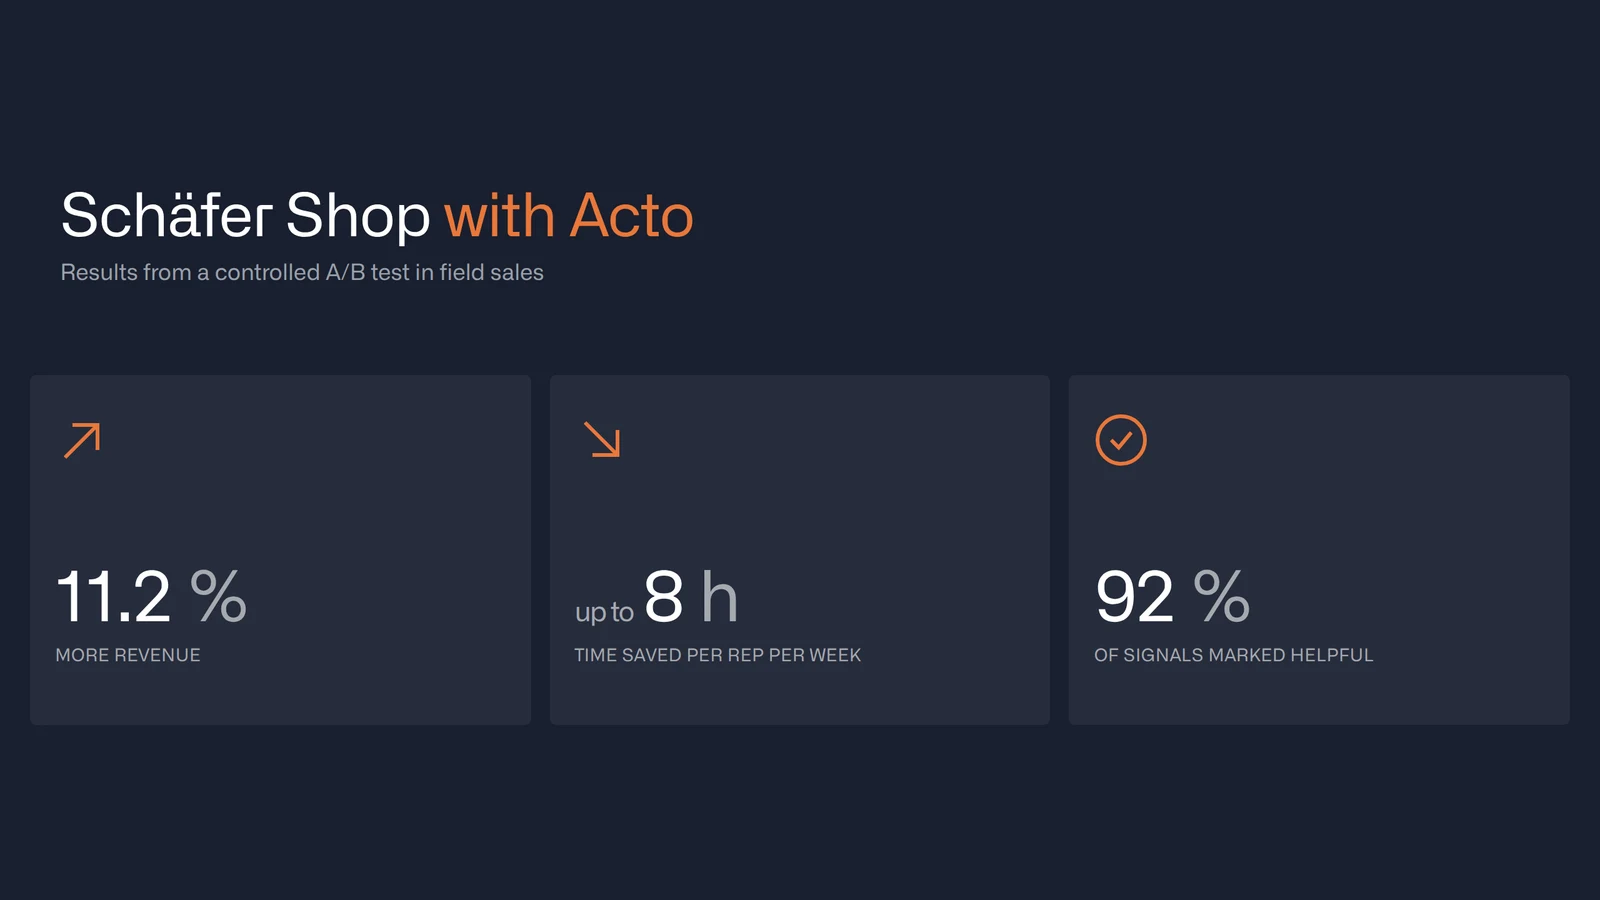
Example: Schäfer Shop, a B2B supplier of office and business supplies, uses Acto to steer its field sales team based on ERP and CRM data. With more targeted visits, focused on the accounts with the highest revenue potential instead of habitual visits, revenue grew by 11.2 percent in a controlled A/B test. That growth did not come from more activity. It came from better prioritisation.
2.3 Level 3: results KPIs (what happened)
Results KPIs describe the past: revenue and gross margin answer the question "What happened?"
Their weakness is that they offer little insight into how to improve those results. They are simply too broad. That is why the two levels below them matter.
Field sales KPI cheat sheet
| KPI | Level | How to calculate it | What it tells you |
|---|---|---|---|
| Number of customer contacts | Activity | Visits + calls + meetings per rep and week | Capacity and effort |
| Contact diversity | Activity | Distinct customers contacted ÷ customers in the territory | Whether reps only see the same accounts |
| Follow-up rate | Activity | Open quotes followed up ÷ all open quotes | Whether quotes are actively converted |
| Revenue per visit | Performance | Revenue in period ÷ visits in period | Value of each visit |
| Quote-to-order ratio | Performance | Orders won ÷ quotes sent | Conversion quality |
| Share of wallet | Performance | Customer spend with you ÷ estimated total spend in your categories | Untapped potential per account |
| Retention rate | Performance | Customers active at end of period who were active at start ÷ customers at start | How well you keep the base |
| Customer lifetime value | Performance | Average annual gross margin × expected years as a customer | How much an account is worth over time |
| Revenue and gross margin | Results | From the ERP, per rep, territory and customer | What was achieved |
Calculation methods are common definitions; adapt them to how your ERP and CRM store the data.
3. Leading vs. lagging indicators: the underrated difference
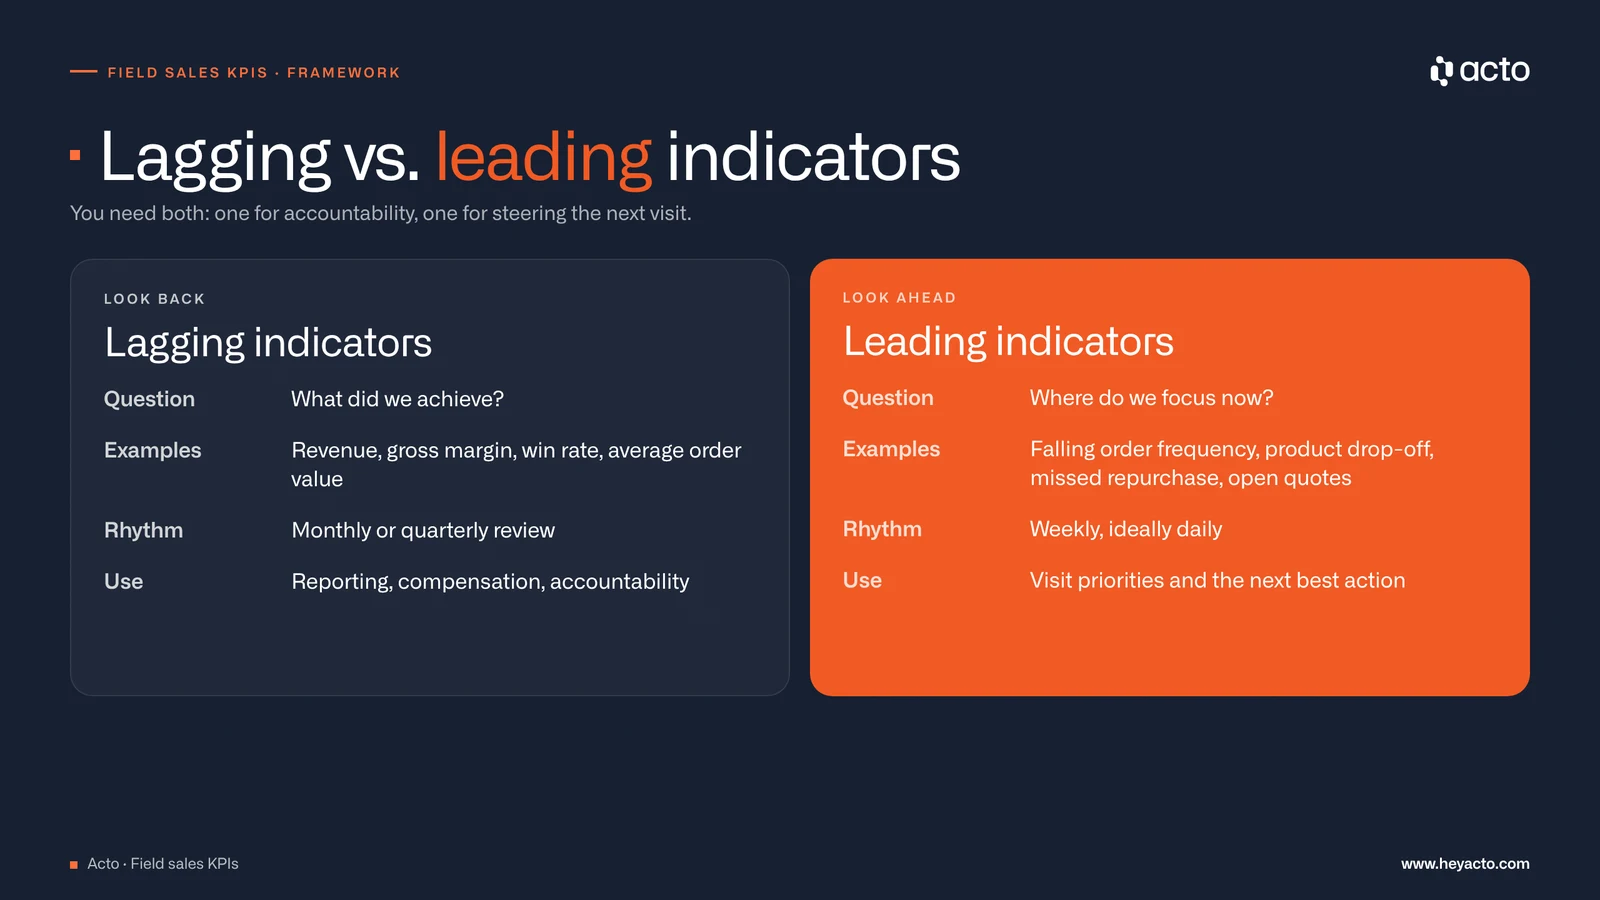
All KPIs fall into two categories: lagging indicators and leading indicators.
Lagging indicators show what has already happened. Revenue, gross margin and win rate are all results of past activity. They matter for reporting and compensation, but they do little for day-to-day steering: if you only see at month-end that revenue has dropped, there is nothing left to correct.
Leading indicators point to future results. Falling order frequency today can mean a lost customer a few months from now. A growing cross-selling rate can mean a higher average order value next quarter. These metrics make it possible to act ahead of time.
The classic trap in wholesale field sales: teams only run lagging-indicator reviews. The monthly meeting asks: how was revenue? Where did the variances come from? What went well and what did not?
Looking back is legitimate, but it does not replace looking ahead. A balanced KPI system always contains both:
Lagging indicators for accountability (what did we achieve?) and leading indicators for steering (where do we focus now?).
4. The KPI data foundation: what your ERP already provides
The most common objection to data-based field sales KPIs in mid-sized companies is: "We don't have the data for that."
In most cases, that is not true. The ERP of almost every wholesaler has held the raw data for all three KPI levels for years. It just is not used systematically.
What the ERP already contains and how it feeds into KPIs:
| ERP data | KPIs you can derive | Leading or lagging |
|---|---|---|
| Order history per customer (date, value, quantity) | Order frequency, average order value, revenue trend, retention rate | Both |
| Line items by product group | Product drop-off, cross-selling rate, share of wallet by category | Leading |
| Purchase prices and net selling prices | Gross margin per customer and product, margin decline, price anomalies | Both |
| Quotes and their status | Quote-to-order ratio, open quotes, follow-up rate | Leading |
| Contracts and framework agreements | Expiring contracts, renewal rate | Leading |
| Customer master data (segment, region, size) | Comparison with similar customers, white spots per segment | Context for all KPIs |
The core problem is not a lack of data. It is the missing translation layer. Raw ERP data does not turn into recommendations by itself. That takes either manual analysis, which is too time-consuming at several hundred accounts per rep, or a system that does the translation automatically. More on this: analysing customer buying behaviour and white space analysis.
Back in 2020, Gartner predicted that by 2025, 60 percent of B2B sales organisations would move from experience- and intuition-based selling to data-driven selling. Teams that still have no systematic KPI data foundation today are falling behind competitors that do.
5. From dashboards to prompts for action: AI-supported sales management
A dashboard nobody opens has no value.
Field reps in wholesale do not sit at a desk. They sit in the car, have just come out of a customer meeting and are driving to the next address. In this routine, KPI dashboards compete with everything else for attention, and they almost always lose.
That is reality, not a lack of discipline. The answer is not a better dashboard. The answer is to replace the dashboard with concrete prompts for action.
Instead of "Here is all the data, draw your own conclusions", the rep gets: "These 7 customers this week. Customer 1 because of a churn alert in fasteners (estimated loss: €8,400 a year), customer 3 because of an untapped upsell in cleaning supplies (potential: €3,200 a year)." (Illustrative example.)
.png)
This is the principle of next best action (NBA): the sales manager does not analyse the KPIs and build a priority list by hand. The system generates the list automatically, with the expected euro impact for each recommendation. How this fits into potential-based selling and overall sales management decides whether a rollout succeeds.
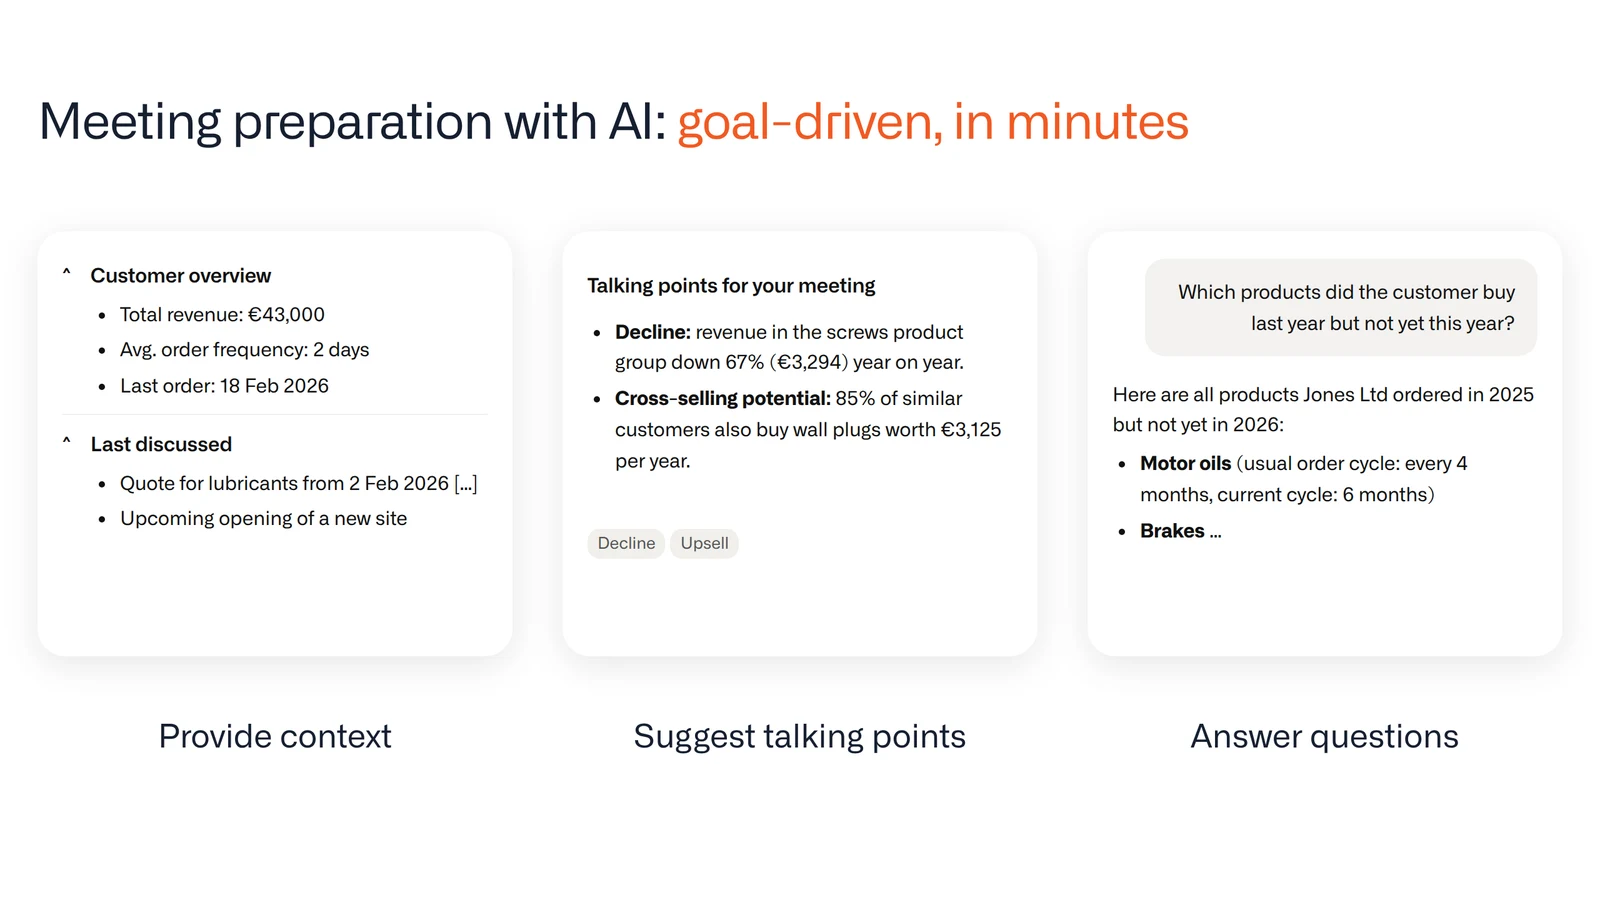
The same signals also shape the meeting itself. With Acto, a rep is prepared for a visit in about two minutes: account context, risk and potential signals, and talking points, in the Acto app or directly in Outlook. At Plate, this saves 1 to 1.5 hours per day.
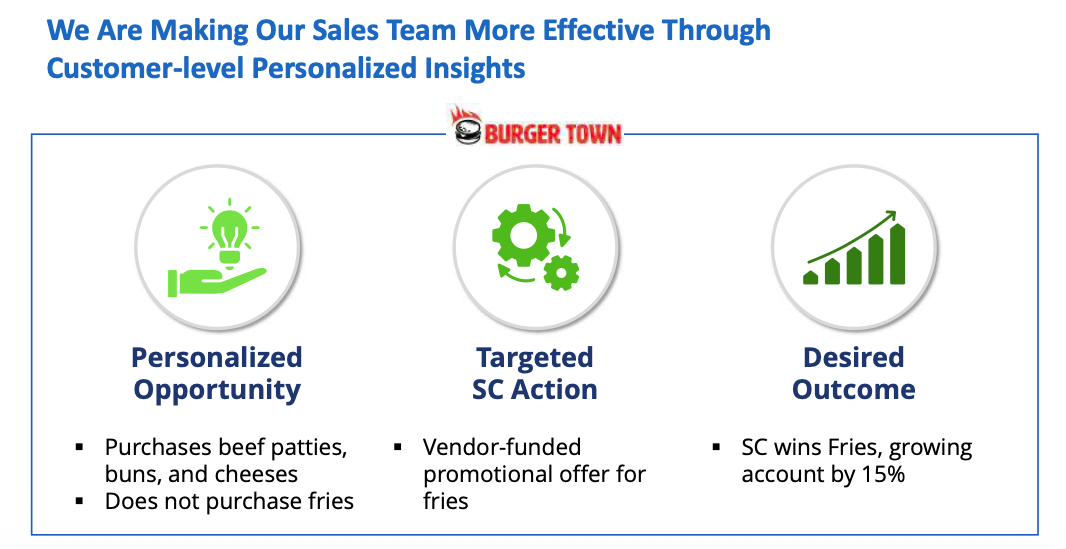
Example: Sysco, one of the world's largest foodservice distributors, presented its approach at its 2024 Investor Day: sales consultants receive customer-level insights. In Sysco's illustrative example, a restaurant buys patties, buns and cheese but no fries; the consultant gets a vendor-funded offer for fries, and the targeted outcome is an account that grows by 15 percent. Sysco now runs this through its AI360 platform, which analyses purchasing patterns to suggest additional products and guide pricing, according to Distribution Strategy Group. The data foundation is the same one every wholesaler has: order history, customer segments, category data.
The result: less time spent analysing dashboards, fewer decisions based on gut feeling, and a data-based reason for every visit.
According to McKinsey, companies using data-driven B2B sales-growth engines report above-market growth and EBITDA increases of 15 to 25 percent. And in the B2BEST Barometer by ECC KÖLN and Creditreform, a survey of 204 wholesalers and manufacturers in Q4 2025, 63 percent rated AI as highly relevant, and 85 percent expect to do so in five years (Creditreform, in German). More on this: AI in field sales.
6. The 5 most common KPI mistakes in field sales
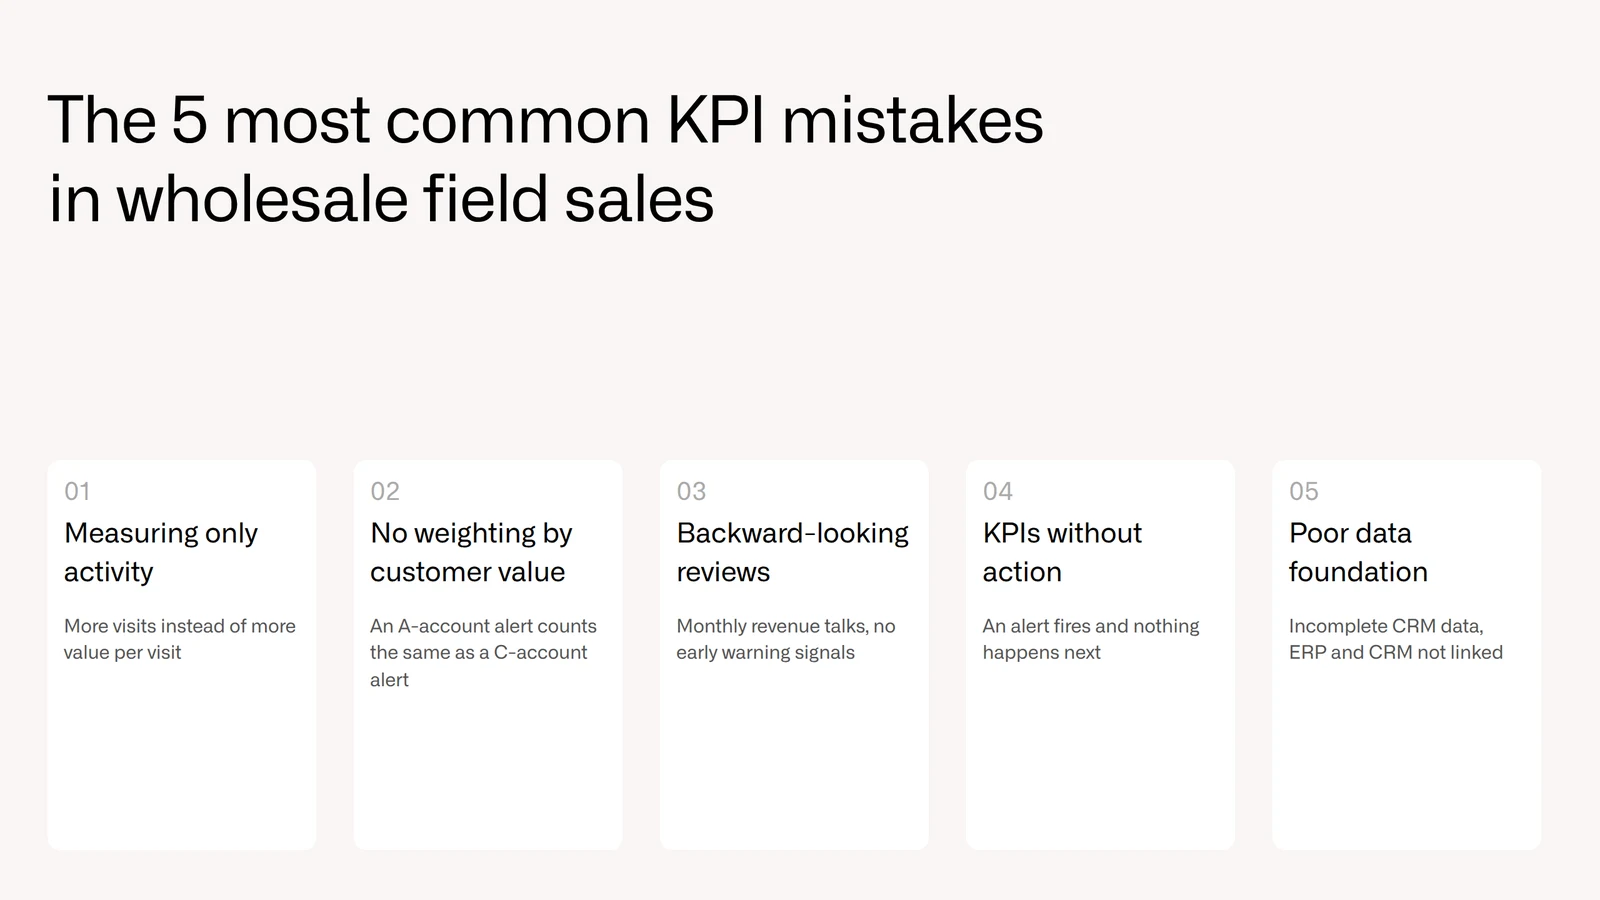
Mistake 1: measuring only activity, not results
Using visit count as the primary KPI leads to the wrong optimisation: as many visits as possible instead of as much value per visit as possible. A rep who makes 12 visits to the wrong customers achieves less than one who makes 7 visits to the right ones.
Mistake 2: no weighting of KPIs by customer value
A churn alert at an A-customer with €200,000 annual revenue is not the same as one at a C-customer with €8,000. If all KPIs carry the same weight, capacity goes into low-priority accounts.
Mistake 3: backward-looking reviews without early signals
By the time revenue is discussed in the monthly meeting, it is already history. A KPI system made only of lagging indicators allows analysis, but not steering. Leading indicators such as churn warnings, falling order frequency or a shrinking cross-selling rate need to be visible weekly, not monthly.
Mistake 4: KPIs with no link to action
What happens when a churn alert fires? When a customer's opportunity score crosses a threshold? A KPI without a defined consequence stays a data point, not a management tool. KPIs only become effective in daily work once they are linked directly to concrete recommendations.
Mistake 5: KPIs without a data foundation, or with the wrong one
Quota attainment, win rate, revenue per visit: all of this sounds precise. But if CRM data is incomplete because follow-up takes too long, if ERP data is not linked to CRM activities, and if visits are not logged systematically, KPIs end up based on estimates rather than facts.
Example: one fix is to make documentation fast enough that it actually happens. With Acto, reps dictate their visit report by voice right after the meeting; Acto creates the CRM note and follow-up tasks, and the information feeds into the next prioritisation. At Schäfer Shop, Acto saves up to 8 hours per rep and week. The result is more complete CRM data as a basis for reliable KPIs, without extra work for the field team. More on this: voice-to-CRM.
Conclusion
KPIs are not an end in themselves.
They exist to steer field sales towards the actions with the biggest revenue contribution, and away from the ones that cost time without effect.
The three-level framework (activity → performance → results) is more than a categorisation. It changes how a sales team thinks: from "How much did we do?" to "What do we need to do next, and why exactly that?"
The technical basis is already in every wholesale ERP. What is missing is the translation layer from raw data to predictive recommendations. That is the step from dashboard to steering.
Curious how Acto puts three-level steering into practice for your field sales team? Book a free demo with our team.
FAQ: field sales KPIs
What are the most important KPIs for field sales?
Use one KPI per level as a minimum: contact diversity (activity), revenue per visit or share of wallet (performance), and revenue and gross margin (results). Add at least one leading indicator, such as falling order frequency, so you can act before results drop.
How many visits per day should a field sales rep make?
There is no universal benchmark; it depends on territory size, customer type and visit length. More useful than a visit target is revenue per visit combined with contact diversity: are the visits going to the customers with the most potential or the highest risk?
What is the difference between leading and lagging indicators in sales?
Lagging indicators such as revenue show what has already happened. Leading indicators such as falling order frequency or open quotes signal what is likely to happen, which leaves time to act. A good KPI system uses both.
Where does the data for field sales KPIs come from?
Mostly from the ERP (orders, line items, prices, quotes, contracts) and the CRM (visits, notes, contacts). Acto connects to systems such as SAP, Microsoft Dynamics and Salesforce, and others via data exchange; see integrations.