How to Prevent Customer Churn: 12 Proven Measures + How to Calculate Churn Rate [2026]
Summary
- B2B distributors lose between 4.33 and 15.07% of annual revenue to customer churn, and in wholesale it often goes unnoticed for months because there is no formal cancellation.
- This article shows how to calculate churn rate, which early warning signs matter and which 12 measures have the biggest impact.
- Plus: the 5 mistakes almost every sales organisation makes.
What is customer churn, and what does the churn rate tell you?
Customer churn (also called customer attrition or defection) describes the share of customers a company loses over a given period because they stop buying, cancel or switch to a competitor.
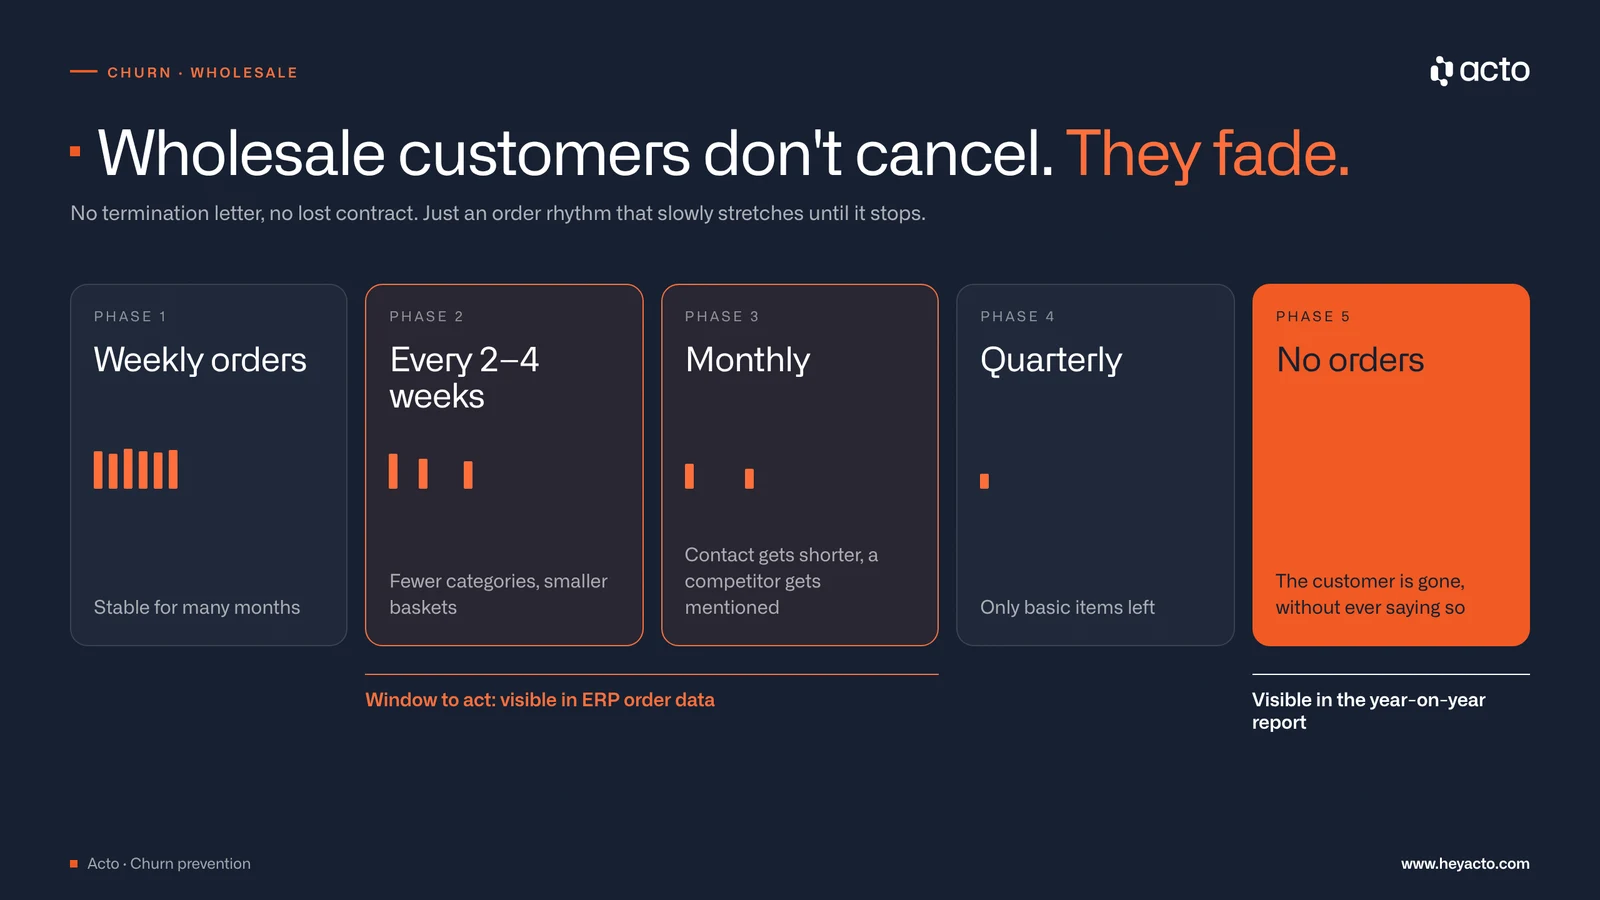
In SaaS or e-commerce, churn is easy to see: a subscription ends, an account is deleted. In B2B wholesale, distribution and manufacturing it works differently. There is no formal cancellation. A customer who ordered every week for 18 months slowly stretches the rhythm to monthly, then quarterly, then nothing. If you don't track this actively, you only notice when the year-on-year comparison in the CRM turns red.
The churn rate puts a number on this loss. It shows, as a percentage, how many customers (or how much revenue) you lost in a period.
Three related terms you will need for the rest of this article:
- Customer churn rate: the share of customers (by headcount) lost in a period.
- Revenue churn rate: the share of revenue lost. This matters most in B2B, where one large account weighs more than ten small ones.
- Net revenue churn: revenue churn minus upselling and cross-selling revenue from existing customers. If this value turns negative, you grow from your existing customer base alone.
Why customer churn is so expensive
Two well-known figures frame the problem. According to Harvard Business Review, acquiring a new customer is anywhere from five to 25 times more expensive than retaining an existing one, depending on the study and the industry. The same article cites research by Frederick Reichheld of Bain & Company showing that increasing customer retention rates by 5 percent increases profits by 25 to 95 percent.
What does that mean in euros? An example calculation:
| Metric | Value |
|---|---|
| Active customers | 500 |
| Average annual revenue per customer | €20,000 |
| Churn rate | 8% |
| Customers lost per year | 40 |
| Revenue lost to churn per year | €800,000 |
Example calculation, not customer data.
Now the other side: what happens if you bring the churn rate down from 8 to 5 percent?
Instead of 40 customers you lose 25. That is 15 customers × €20,000 = €300,000 in retained annual revenue, before counting the acquisition cost you no longer need to spend on replacing them.
Distribution benchmarks point in the same direction. As Modern Distribution Management reports, citing a 2022 benchmarking report from Zilliant, B2B distributors worldwide lose between 4.33 and 15.07 percent of their annual revenue to customer churn. For a company with €50 million in revenue, that is between €2.2 and 7.5 million every year.
Even one percentage point makes a big difference over time. Datasolut (in German) uses this comparison: two companies start with 10,000 customers each. The first has a monthly churn rate of 2.5 percent, the second 1.5 percent. After 12 months, the second company's customer base is 13 percent larger.
Churn prevention belongs to the core business. Why existing customers are often more profitable than new ones is explained in detail in a separate article.
How to calculate churn rate: formula, examples and industry benchmarks
The formula
Churn rate (%)= (customers lost ÷ customers at the start of the period) × 100
Monthly example: you start the month with 200 customers and lose 6. Churn rate = (6 ÷ 200) × 100 = 3%
Annual example (more relevant for B2B): you start the year with 500 customers and lose 40. Churn rate = (40 ÷ 500) × 100 = 8%
An important nuance for B2B: in wholesale you should measure revenue churn as well as customer churn. A customer who cuts annual revenue from €80,000 to €15,000 does not show up in the customer churn rate at all. In revenue churn, it does.
Revenue churn rate (%)= (revenue lost ÷ total revenue at the start of the period) × 100
Churn rate benchmarks by industry
| Industry | Typical churn rate (per year) | Source |
|---|---|---|
| IT services | approx. 12% | CustomerGauge |
| Computer software (SaaS) | approx. 14% | CustomerGauge |
| Industry services | approx. 17% | CustomerGauge |
| Financial services | approx. 19% | CustomerGauge |
| Professional services | approx. 27% | CustomerGauge |
| Telecommunications | approx. 31% | CustomerGauge |
| Manufacturing | approx. 35% | CustomerGauge |
| Logistics | approx. 40% | CustomerGauge |
| Wholesale | approx. 56% | CustomerGauge |
Annual account-level churn from CustomerGauge's B2B benchmarks (2025 data, as of 10/2026).
Wholesale has the highest churn rate in this comparison. Part of the explanation is structural: many wholesale customers buy from several suppliers in parallel, so switching costs are low and orders can move quietly. Your own number may differ a lot depending on how you define "lost", so compare it mainly with your own trend over time.
Christian Schütte, managing director of the sales consultancy SUXXEED (in German), sets a clear target (translated from German):
"With a well-managed customer base, the churn rate is 3 percent at most."
That is the north star. And at the same time the most honest mirror for most sales organisations.
Voluntary vs. involuntary churn: why the difference matters
Not all customer churn is the same, and not all of it can be prevented.
Voluntary churn is the result of a conscious decision by the customer: dissatisfaction with product or service, a better offer from a competitor, a relationship that was not looked after. This type is directly linked to customer satisfaction. All measures in this article address this category.
Involuntary churn happens because of external factors you cannot control: the customer goes insolvent, is acquired, the industry consolidates, payments default. No retention programme helps here. You need other tools: credit checks, early indicators of financial distress, contractual safeguards.
If a customer is lost to an external shock, that is not a sales problem. If they leave because nobody paid attention, it is.
The 7 most common causes of customer churn
If you don't know the causes, you end up fighting symptoms.
1. Feeling unimportant
Many customers who leave do not go because of price or product. They go because they feel the supplier no longer cares about them. This is one of the strongest and most underestimated drivers of churn, and it builds up quietly.
2. Reactive instead of proactive service
If you only respond when the customer reports a problem, it is often too late. B2B customers expect you to anticipate shortages and needs before they arise.
3. Too little contact, or the wrong kind
In B2B, silence is read as indifference. No call, no email, no visit. Then a competitor turns up and asks.
4. A shifted perception of value
The perception of value shifts: the customer no longer sees what they get for their money. This happens gradually and often without anyone noticing.
5. A competitor was faster
Usually the result of the first four points. A competitor showed the right attention at the right time. The door was already open.
6. Changed needs
The customer has grown, has new requirements, or their market has changed. If you don't grow with them, you lose them.
7. Relationship management in field sales falls short
This is often the biggest blind spot in B2B wholesale: reps visit the customers where the conversation is easy, not the ones with the highest churn risk right now. It is a structural problem. Without data, you simply don't know who needs your attention at the moment.
If you want to set up account management for existing customers on a systematic basis, that article is a good place to start.
Early warning signs: how do you know a customer is about to leave?
This is the decisive moment in churn prevention. The signals were almost always there. Nobody was looking.
| Behavioural signals | Relationship signals |
|---|---|
| Falling order frequency: a customer who bought weekly now only orders every two to four weeks | Appointments are cancelled or postponed at short notice |
| Smaller order quantities or a falling average order value | Your usual contact is suddenly "unavailable" or delegates downwards |
| Fewer product categories in the basket: the customer narrows the range to the basics | Conversations get shorter, more formal, more distant |
| Longer payment terms or more frequent late payments | New names from purchasing appear that you don't know |
| No response to quotes, campaigns or newsletters | The customer casually mentions competitors or "other offers on the market" |
| Returns or complaints pile up | Strategic topics (annual planning, new projects) are no longer discussed with you |
| No reaction to new products or price changes, where there used to be feedback |
How CRM and ERP data help
These signals are in your data. The problem: a rep who looks after hundreds of accounts cannot keep an eye on all of them at once. Nobody can manually evaluate several hundred data points a week.
Professors Christian Schmitz and Jan Wieseke of the Sales Management Department at Ruhr University Bochum (in German) recommend a customer structure analysis based on revenue data as the starting point: it shows which customers carry the business and how sales resources should be allocated across segments. Adding behavioural data such as order frequency on top of that is what turns a static segmentation into an early warning system.
Tools such as Acto analyse patterns in CRM and ERP data automatically and tell the field sales team which customers need more attention right now, as a concrete recommendation in their daily work. How this works technically is described in the article on predictive analytics in wholesale.
Churn management vs. churn prevention: what's the difference?
Briefly, because the two are often confused:
Churn prevention is proactive. You spot signals before the customer leaves and act on them: early warning systems, targeted visits, individual offers. Cheaper, more effective, and the focus of this article.
Churn management is reactive and strategic. You analyse why customers left, try to win them back and adjust the organisation. More expensive and more effort, but necessary when churn has structural causes.
Both need a professional sales team. Prevention is always cheaper than reaction. If you want to bring back customers whose orders have already dropped off, read our guide on how to drive repeat purchases.
12 measures to prevent customer churn
This is the core of the article. Twelve measures, sorted by impact, with concrete notes on how to put them into practice.
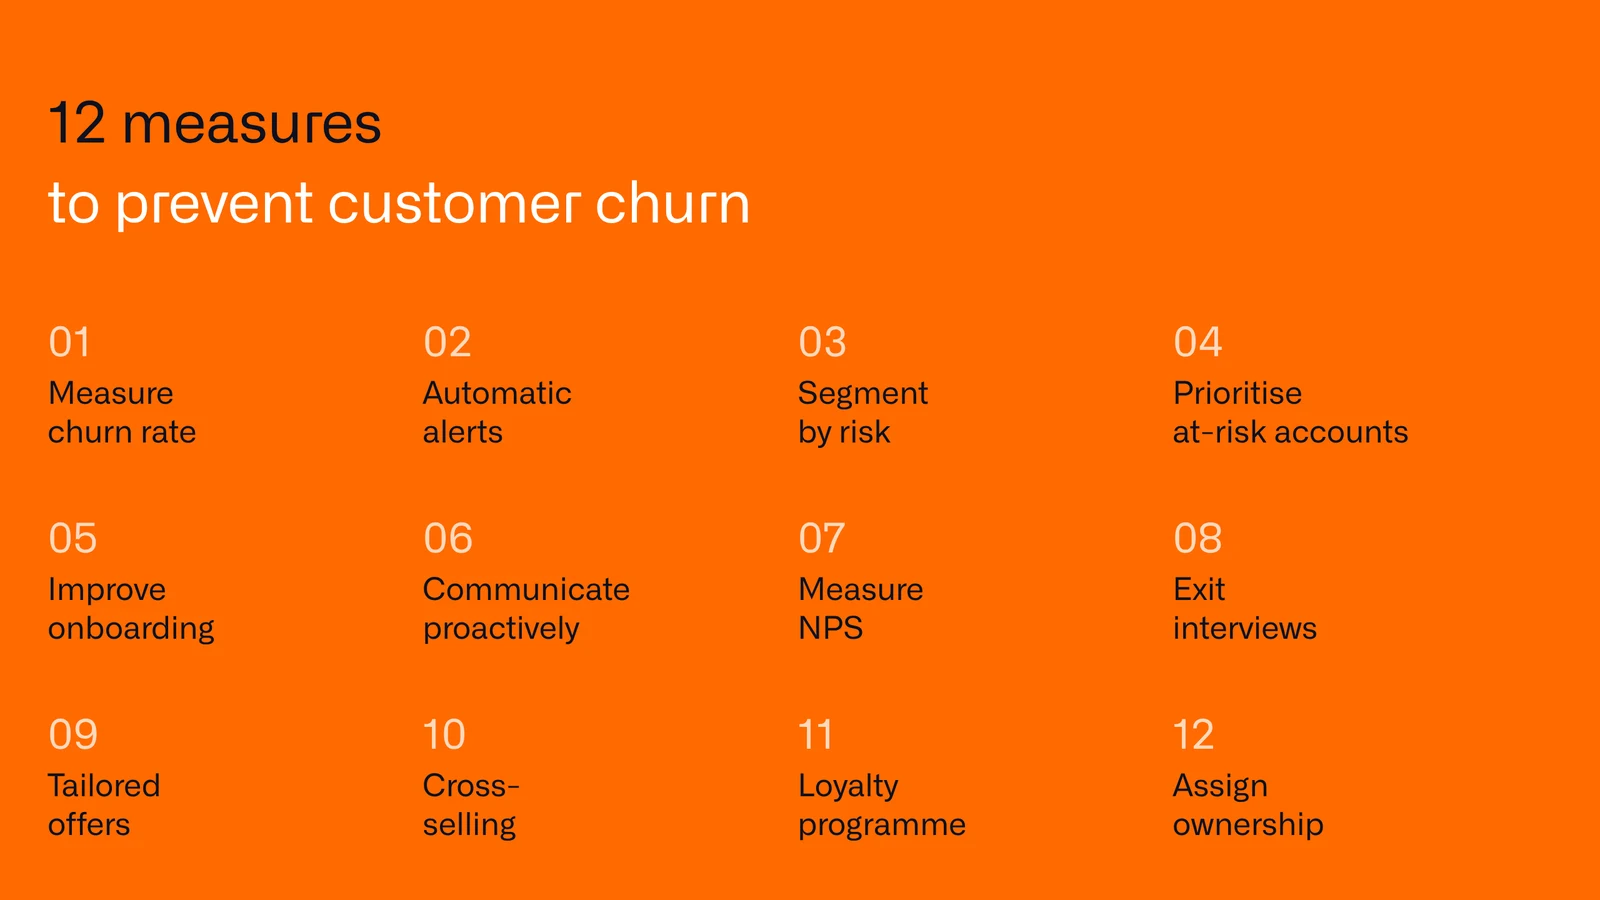
1. Measure churn rate regularly
Sounds trivial. It isn't. Most B2B companies measure customer churn (if at all), but not revenue churn. Start tracking both every month. What you don't measure, you can't manage. The article on field sales KPIs shows which other metrics belong on the same dashboard.
2. Build an early warning system
Set up automatic alerts in your CRM when a customer who historically buys weekly has not ordered for four weeks. This doesn't require extra software, just configuration time and discipline.
3. Segment customers by churn risk
Not every customer needs the same attention. Segment your customer base along two axes: current and potential customer value, and churn risk based on behavioural data. The combination shows where action is needed right away. A study by the Sales Management Department at Ruhr University Bochum (in German) found that companies that cluster their customers in a targeted way achieve, among other things, 6.89 percent more revenue with existing customers.
4. Visit at-risk customers actively and deliberately
This is the biggest lever in B2B field sales, and at the same time the one least often approached systematically. Böllhoff followed exactly this approach: with data-based visit prioritisation instead of gut feeling, Acto users achieved +8.6 percent revenue growth compared with non-users. If you allocate visit time by habit instead of urgency, you waste your most important lever.
.png)
5. Improve onboarding
Early churn, meaning customers who leave in the first three to six months, often comes from poor onboarding. The customer has bought but feels left alone. A clear onboarding process with milestones and fixed touchpoints prevents this.
6. Communicate proactively
Don't wait until the customer has a problem. Call before they have to. A short monthly update, a piece of market information, a note about a new product that fits their needs: all of this shows that you are paying attention.
7. Measure NPS and customer satisfaction in a structured way
The Net Promoter Score is not a magic number, but it is a useful early signal. A falling NPS often shows up before the drop in revenue does. Run short, regular customer surveys and respond to negative feedback within 48 hours.
8. Hold exit interviews
If a customer leaves anyway, call them. The goal is to understand why. These conversations are free market research. Record the reasons in a structured way and review them every quarter.
9. Develop individual offers for at-risk customers
No blanket approach. A discount for everyone is neither economical nor effective. Once you know which customers show increased risk, you can act in a targeted way: an individual offer, a package that matches current needs, or a concrete service improvement.
10. Use cross-selling as a retention strategy
A customer who buys several product categories from you is more firmly tied to you than one who buys a single category. Switching becomes more effort, and the supplier relationship goes deeper. That makes cross-selling a lever for both revenue and churn prevention. Analysing buying behaviour systematically shows where the cross-selling potential lies.
11. Introduce customer loyalty programmes
Classic points programmes are often a poor fit in B2B. Loyalty can also mean early access to new products, a dedicated contact person, or faster delivery for regular customers. What counts is perceived value, not the mechanics of the programme.
12. Clarify internal ownership
Who in your company is responsible for churn prevention? If the answer is "everyone, really", the honest answer is: nobody. Name a person or team that owns the churn rate, reports on it every month and coordinates measures. Without clear ownership, nothing happens.
Churn score and predictive analytics: AI as an early warning system
A churn score is a probability value, often shown on a scale from 0 to 100, that indicates how likely a specific customer is to churn in the next 30, 60 or 90 days. It is calculated from behavioural data: order frequency, product categories, contact frequency, response to campaigns.
Predictive analytics goes one step further. Instead of only describing historical data, the model identifies which behaviour patterns actually led to churn in the past, and looks for those patterns in current customers before they leave. The difference between predictive and prescriptive analytics is that the latter also recommends what to do next.
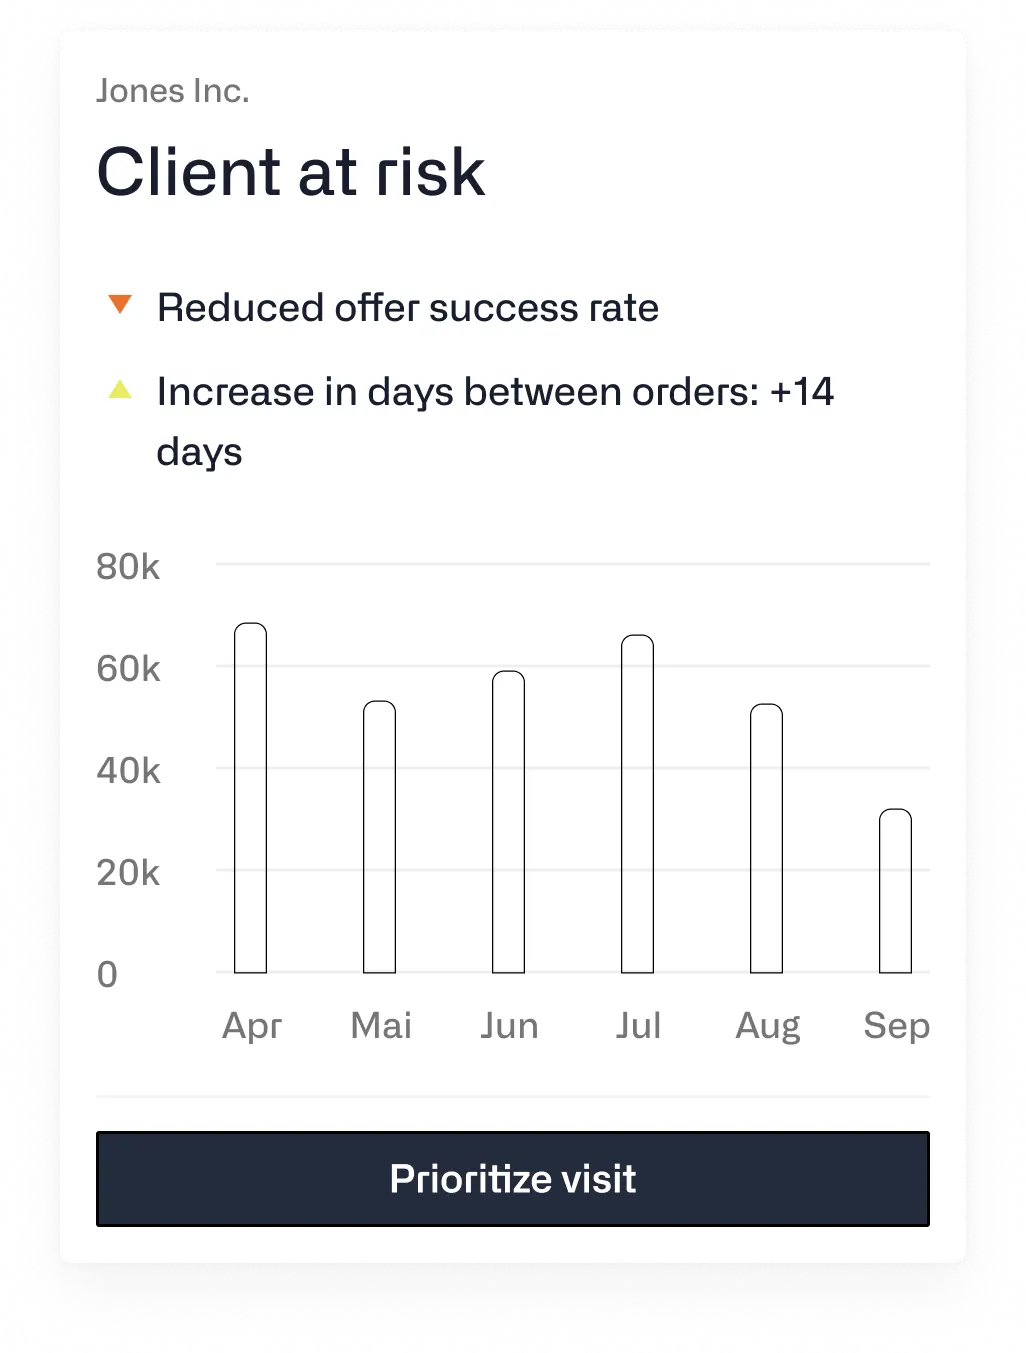
For the field sales team the output looks like this: a prioritised list of customers who need attention this week, sorted by urgency. Recommendations for action instead of raw data, in other words the next best action per account.
An important limitation: predictive analytics is only as good as the data underneath. Without a well-maintained CRM and clean order data, an AI system produces noise instead of recommendations. Data hygiene first, then the early warning system.
What this looks like in practice in wholesale is described in detail in the article on predictive analytics in wholesale.
The 5 most common mistakes in churn prevention
Almost every sales organisation makes at least one of these.
| Mistake | Why it happens | The fix |
|---|---|---|
| Focusing only on new customers | Incentives and quotas are tied to new customer acquisition | Set explicit targets and budget for retention and growth with existing customers, not only for new business |
| Only reacting once the customer has gone | No early warning system, no structured monitoring | Set up CRM alerts for inactivity, define a proactive contact cycle |
| Looking at churn rate in isolation | KPI silos: marketing, sales and finance don't talk to each other | Always measure churn in the context of customer lifetime value; a single number without context tells you little |
| The same retention programme for every customer | Operational convenience, "one size fits all" | Segment by value and risk, individual measures instead of a blanket approach |
| Sending field sales out without data | "They know their customers" | A structured briefing before every visit: which signals are there, what potential, what risk? |
The last point hurts the most. Sales reps are not data analysts, and they shouldn't have to be. But they need the right information at the right time. A field sales team that relies on gut feeling and visit habits fights churn reactively. The coffee at the regular customer tastes good, while the at-risk customer waits without a visit. A structured visit report after every meeting closes the loop, so the next visit doesn't start from zero.
When churn prevention is not the right tool
Not every approach fits every situation. Being honest about this protects you from the wrong investments.
A small customer base of fewer than 50 accounts: no tool replaces the personal relationship that is possible and sensible at this size. Manual tracking is enough. An investment in an early warning system will not pay off here.
Missing or poor data: if your CRM isn't maintained consistently, or order data sits in an ERP that nobody analyses regularly, every analytics tool will produce nonsense. Data hygiene first, then a prevention tool.
A structural product problem: if customers leave because of quality issues, delivery problems or the wrong product positioning, no early warning system changes the starting point. Better data for field sales does not solve a fundamental product problem.
Involuntary churn: if a customer goes insolvent, is taken over by a competitor or their industry consolidates, better visit cycles won't help. These risks call for other tools: credit monitoring, contract structures, portfolio diversification.
If one of these points applies to you: pulling the wrong lever costs time and budget. The right lever starts with the right diagnosis.
Acto: detect churn risks in field sales automatically
For field sales teams at wholesalers, distributors and manufacturers with direct sales who don't want to leave churn prevention to gut feeling, there are now specialised solutions.
Acto is AI sales intelligence for field sales. Instead of another CRM dashboard, it gives each rep proactive recommendations on the way to the next customer.
In practice, this means:
Detect churn risks automatically: Acto analyses patterns in CRM and ERP data, including churn risk from an AI model, declining revenue or orders, product drop-off and missed repurchases, and recommends which customers need attention now, before revenue tips over. The rep gets a prioritised list, not raw data.
Walk into every visit prepared: the most important information, risks and potential for each customer at a glance. A rep is ready for a meeting in about two minutes, with the briefing available in the Acto app and in Outlook.
Capture what happened: after the meeting, reps record the visit report by voice. That information feeds into the next prioritisation, so a warning signal does not get lost between two visits.
At Hitado, inside sales receives ten prioritised signals every day. Ilka Greco, Inside Sales Lead, describes the effect:
"This enables targeted and efficient customer engagement—and we have significantly reduced churn."
.webp)
See in 30 minutes which of your customers are at risk of churning right now, and what your field sales team can do about it today.
→ Book a demo
FAQ: customer churn
How do you calculate churn rate?
Churn rate (%) = (customers lost ÷ customers at the start of the period) × 100.
Example: you start the month with 200 customers and lose 6. Churn rate = 3%. In B2B you should also measure revenue churn, because losing a large account barely shows in the customer count, but it does in lost revenue.
What is a good churn rate in B2B?
Benchmarks vary widely by industry and by how churn is defined. CustomerGauge's B2B benchmarks range from around 11 percent per year in energy and utilities to around 56 percent in wholesale. Christian Schütte of SUXXEED puts the target for a well-managed customer base at a maximum of 3 percent. More useful than any external benchmark is your own trend over time, and revenue churn is always more meaningful than customer churn.
What is the difference between churn management and churn prevention?
Churn prevention is proactive: you spot risk signals early and act before the customer leaves. Churn management is reactive and strategic: you analyse why customers left, try to win them back and adjust structures. Prevention is cheaper. Management is necessary when churn has structural causes.
How can I tell whether a customer is about to leave?
The strongest signals: falling order frequency (it was weekly, now it's monthly), fewer product categories in the basket, falling average order values, no response to quotes and campaigns, and fewer conversations and callbacks. You can find these patterns in your CRM and ERP data if you look for them systematically.
Is investing in churn prevention really worth it?
According to Harvard Business Review, acquiring a new customer costs five to 25 times more than retaining an existing one. In our example, a company with 500 customers and 8 percent churn loses 40 customers a year; at an average annual revenue of €20,000, that is €800,000 in lost revenue. Cutting the churn rate by 3 percentage points keeps €300,000 in annual revenue. For most wholesalers, the sooner you start, the more revenue stays in the business.