White Space Analysis in Wholesale: How to Find Untapped Customer Potential

Summary
- The goal: find untapped revenue potential with existing customers and in new markets, the white space on your sales map (also called white spot analysis).
- 3 dimensions: regional (where is market penetration too low?), assortment (which products do customers need but buy elsewhere? The cross-selling lever) and customer (which companies match your best customers but do not buy from you yet?).
- The payoff: raising share of wallet with existing customers is usually far cheaper than winning new ones, and AI turns the annual analysis into daily, data-based visit priorities for field sales.
What is a white space analysis?
Search for "white space analysis" (in German-speaking markets usually called "white spot analysis") and most results come from geomarketing providers:
Population density, catchment areas, site planning for retailers and franchise systems. Kai Barenscher, Senior Manager at WIGeoGIS Vienna, describes the classic definition like this: "We have been using spatial analysis methods for many of our customers for many years to identify so-called white spots. White spots are areas and regions with high potential, where the company is not yet represented or only insufficiently represented." That is accurate. But it is only half the story.
In B2B wholesale and distribution, white space means something broader.
White space is any area on your sales map that has potential but is not yet covered.
Geographically, it can be a region where your market penetration is well below your own benchmark.
In the assortment, it is a product category that an existing customer needs but has never bought from you. On the customer side, it is companies that match your ideal customer profile but are not yet in your portfolio.
The key difference from a market potential analysis:
A market potential analysis answers the question "How big is the cake?"
A white space analysis answers the question "Which slices are still on the table?"
Methodologically, the approach goes back to the growth-share matrix that BCG developed in the late 1960s and popularised around 1970: plotting business units by market share and growth potential to set strategic priorities. That basic logic, potential versus current performance, is still the foundation of every white space analysis today, whether geographic or customer-based.
For a wholesaler or distributor, this means in practice: you map your product groups against your customers' needs. Where there is demand but no revenue, that is your white space.
Why white space analysis matters so much in wholesale
The pressure on distributors is real. In a survey by BGA, the German Federation of Wholesale, Foreign Trade and Services (in German), two thirds of wholesalers reported falling revenues in the second half of 2024, and 40 percent expected a further decline in 2025. BGA president Dr. Dirk Jandura (translated from German):
"Two thirds of wholesalers recorded falling revenues over the last six months." In a sector that, according to BGA (in German), moves goods and services worth around 1.7 trillion euros a year and employs around 2 million people, that is not statistical noise.
In this environment, it is no longer enough to drive the same routes you have always driven.
The core problem in wholesale sales is structural. A field sales rep looks after several hundred accounts, often far more than they can visit in a year. Which customers make it onto this week's list is usually decided by experience, habit and personal relationships.
Or, as one sales manager put it to us (translated from German): "In the end, you visit the customers where the coffee tastes best."
The result: existing customers systematically buy below their potential. Another sales director described the core problem even more bluntly during a joint meeting (translated from German): "Our B and C customers don't really feel looked after. We only react when something goes wrong."
Motivation is rarely the issue. Reps simply lack the information about where the potential is.
At the same time, BGA (in German) observes that digital platforms with high price transparency are pushing into traditional wholesale structures. Winning new customers is getting more expensive, not cheaper. A widely cited figure from Harvard Business Review puts acquiring a new customer at five to 25 times the cost of retaining an existing one. And McKinsey notes that with AI, external data sets and advanced analytics, companies can now quantify "the spend opportunity of every single customer (existing or potential), including all the products and services they should be buying."
Yet a large part of the potential in the existing customer base stays unidentified and untouched. Share of wallet, the share of a customer's total demand that they buy from you, is the key indicator here:
An A-customer with a low share of wallet is white space that belongs on the agenda right away.
The 3 dimensions of white space in wholesale
This is the section most articles on the topic leave out, because they think of white space purely in geographic terms. In wholesale and distribution there are three separate dimensions, each with its own data and method.
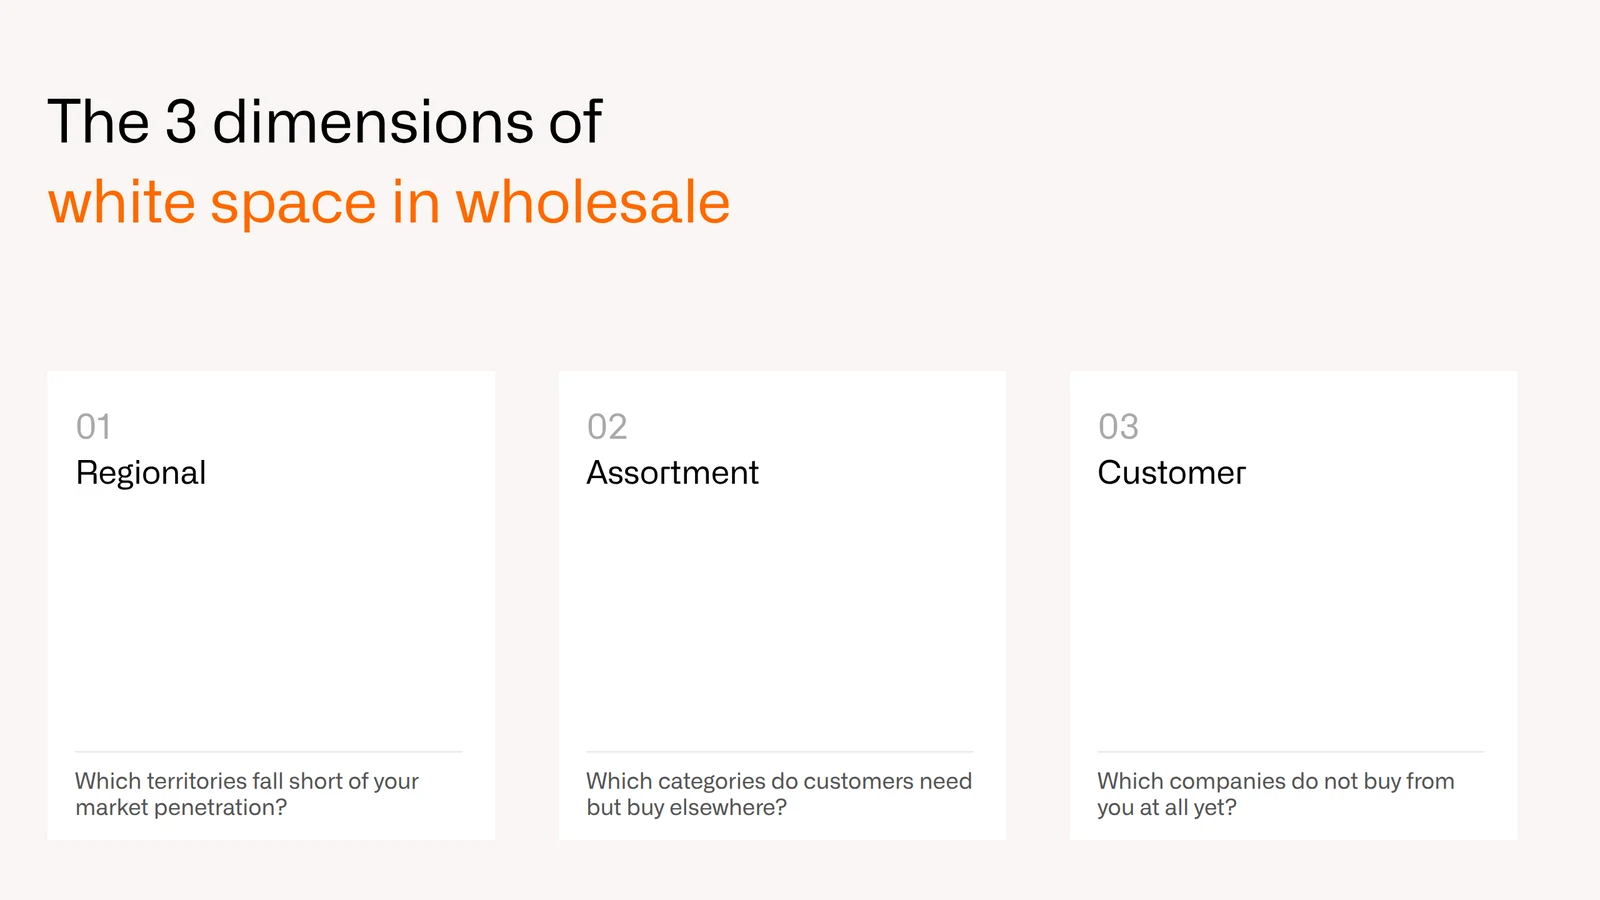
Dimension 1: Regional
The classic perspective, adapted to B2B.
The question in B2B: "In which regions is our customer penetration well below the industry average?" Where to open a new branch is a retail question.
An example: in one region there are 50 potential customers of the right industry and size. Eight of them buy from you, which is 16 percent market penetration, while you reach 35 percent in comparable regions (example figures). That region is regional white space.
Data you need: your own customer master data plus external market data (company registers, industry codes such as NACE or NAICS). Comparing the two shows where you are systematically below your own benchmark.
Dimension 2: Assortment
This is the biggest lever in wholesale, and the one most often overlooked.
An existing customer has been buying in category A for years. They never buy in category B. Yet B would be an obvious fit: same industry, same needs, same supply chain. So why do they buy it elsewhere?
Three possibilities:
- They don't know that you also offer B.
- They tried it once and were not satisfied.
- Or they buy B from a competitor, and nobody has noticed.
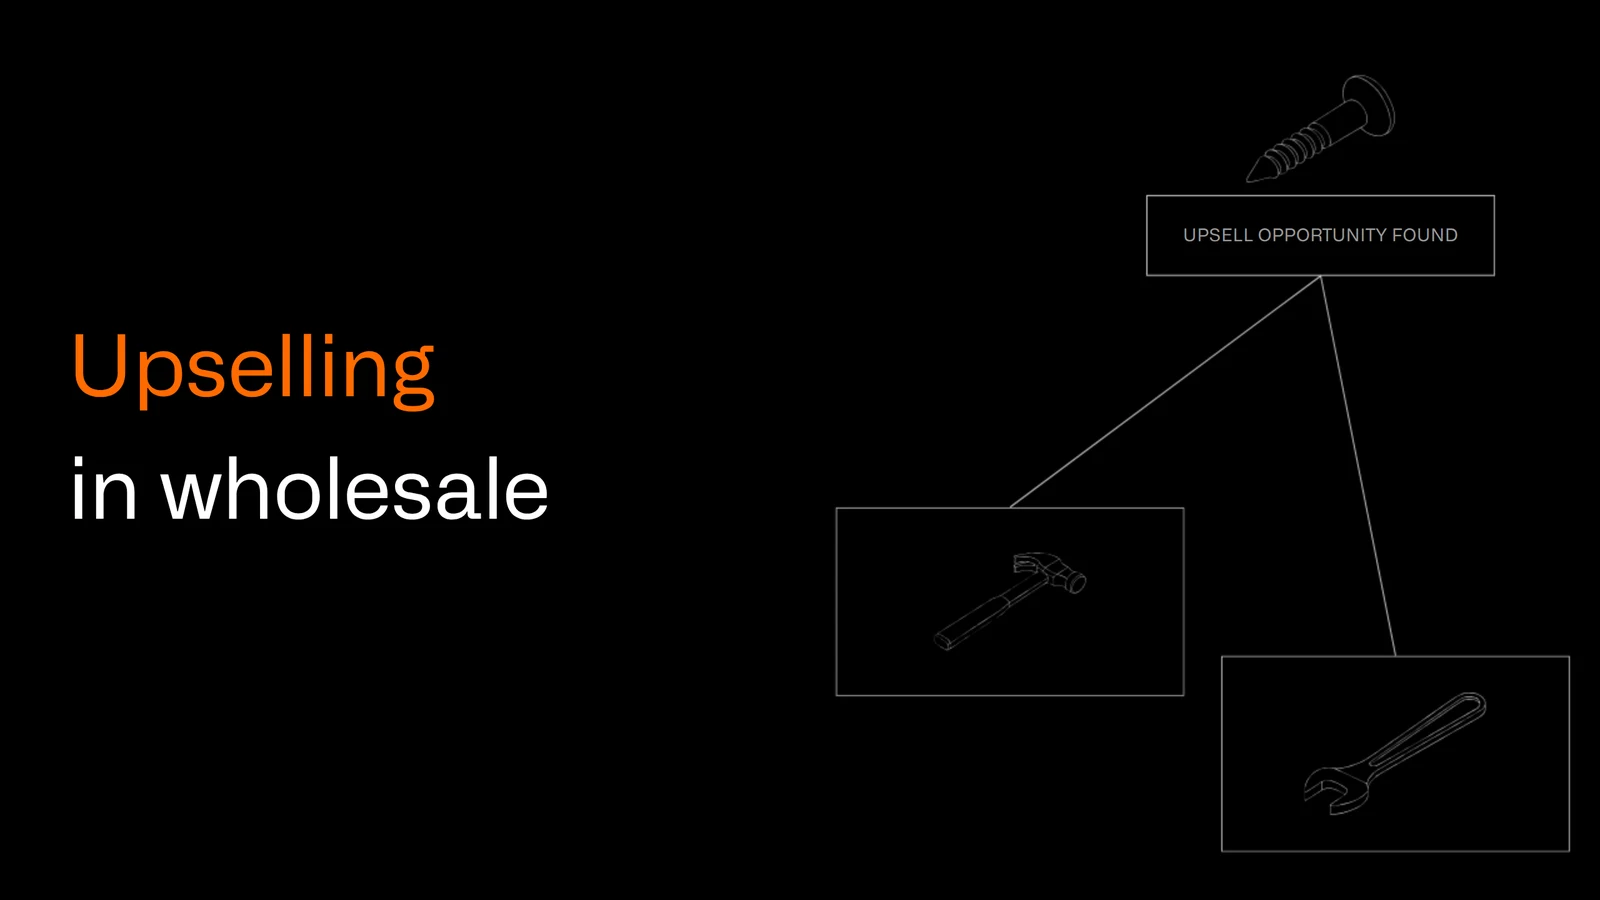
Cross-selling to existing customers is almost always cheaper than winning new ones. A purchase history analysis per customer, measured against the assortment breadth of comparable customers, makes these gaps visible. More on this: upselling in wholesale.
Example: a plumbing and heating distributor analyses its existing customers and finds that a considerable share of installers regularly order pipes and fittings but never tools, even though the range is there and competitors serve that demand. That is assortment white space with a clear call to action.
Dimension 3: Customer
Which companies do not buy from you at all, even though they match your ideal profile?
You take your most profitable existing customers (by contribution margin), analyse what they have in common (industry, company size, region, assortment breadth) and look for companies in the market with the same characteristics that are not yet customers. The result is a prioritised list of prospects that are likely to become profitable because they resemble your best customers, a far better starting point than a generic cold-calling list.
A sound potential analysis combines all three dimensions and gives you a prioritised overview: where are you leaving how much revenue on the table right now?
White space analysis methods at a glance
Three approaches have proven themselves in B2B sales, each with different strengths:
Portfolio matrix approach
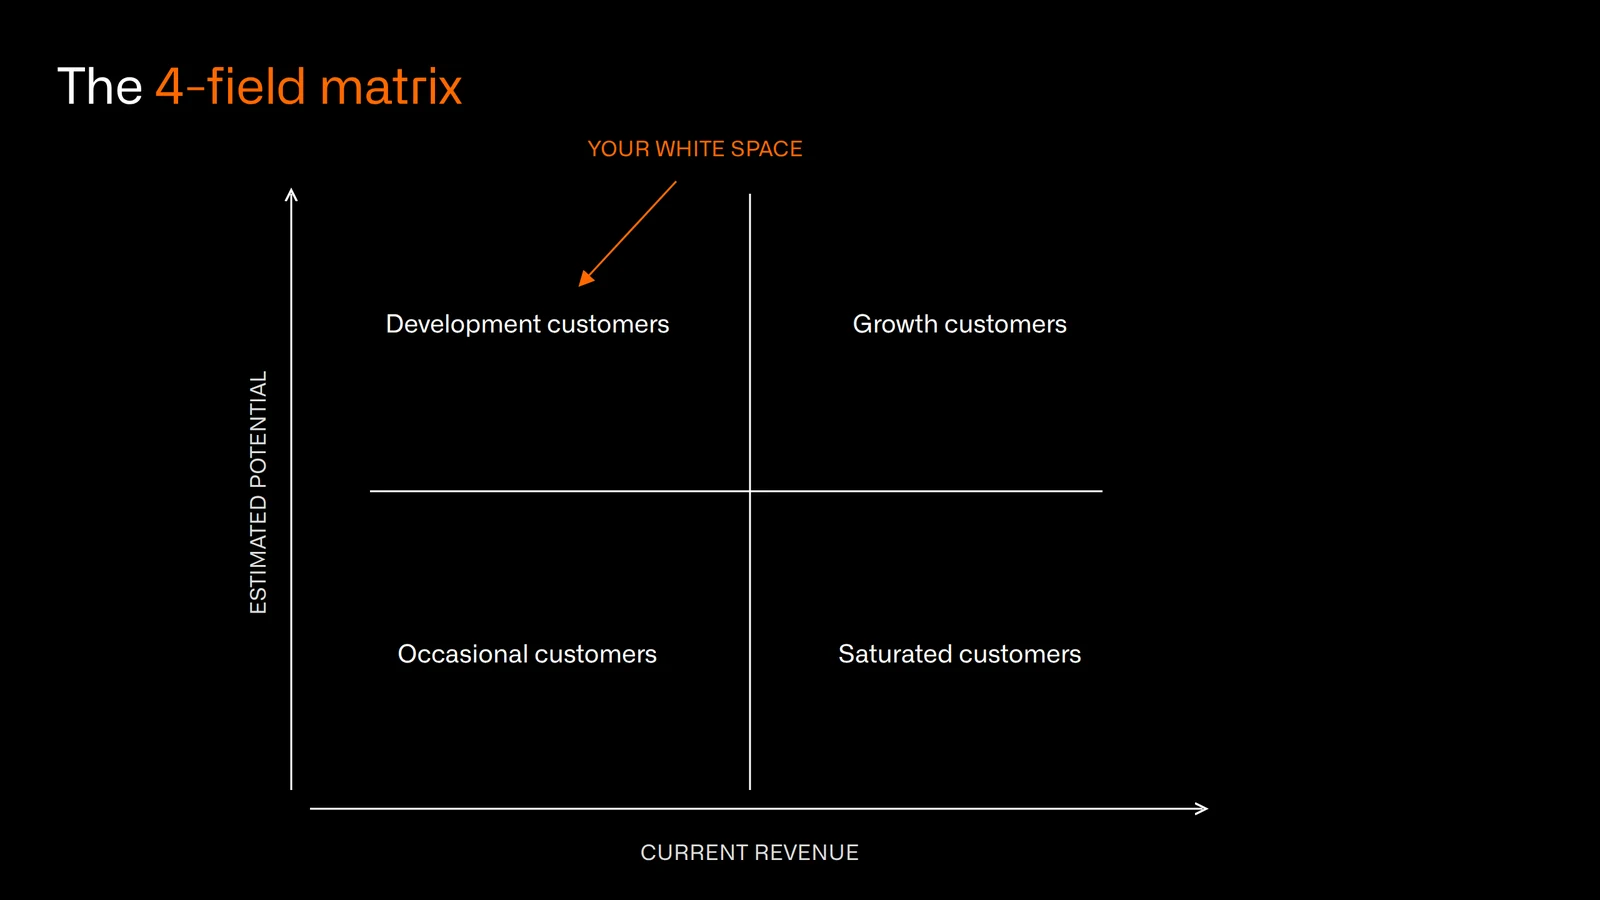
You place customers or market segments in a 2x2 matrix in the spirit of the BCG matrix: the x-axis is current revenue (or contribution margin), the y-axis is estimated potential.
The advantage of this method: it is intuitive and creates clarity about priorities right away, even without digging deep into the data. The top-left field, high potential and low current revenue, is where your white space sits.
Scoring model
Customer data from CRM and ERP is translated into a weighted points system. Criteria can include:
- Purchase frequency
- Assortment breadth
- Industry
- Company size
- Complaint rate
- Visit history
The result is a prioritised customer list, sorted by the potential you can realistically capture.
Schmitz & Wieseke (in German), a B2B sales consultancy that works with research from the Sales Management Department at Ruhr University Bochum, describes the approach: based on calculated customer potentials, regional market potentials, degree of exploitation, market shares and white spots can be visualised. If the description relies on easily determined characteristics such as employee count or NACE code, the analysis can then be transferred from existing to potential new customers.
Market comparison and benchmarking
You compare your customer penetration rate with the industry average, or with your own best region as an internal benchmark. Where you are systematically below it, there is potential white space.
| Method | Data basis | Effort | Result |
|---|---|---|---|
| Portfolio matrix | Revenue + potential estimate | Low | Strategic prioritisation |
| Scoring model | CRM/ERP (purchase history, attributes) | Medium | Prioritised customer list |
| Market comparison | Own data + external market data | High | Regional gaps identified |
Step by step: how to run a white space analysis in wholesale
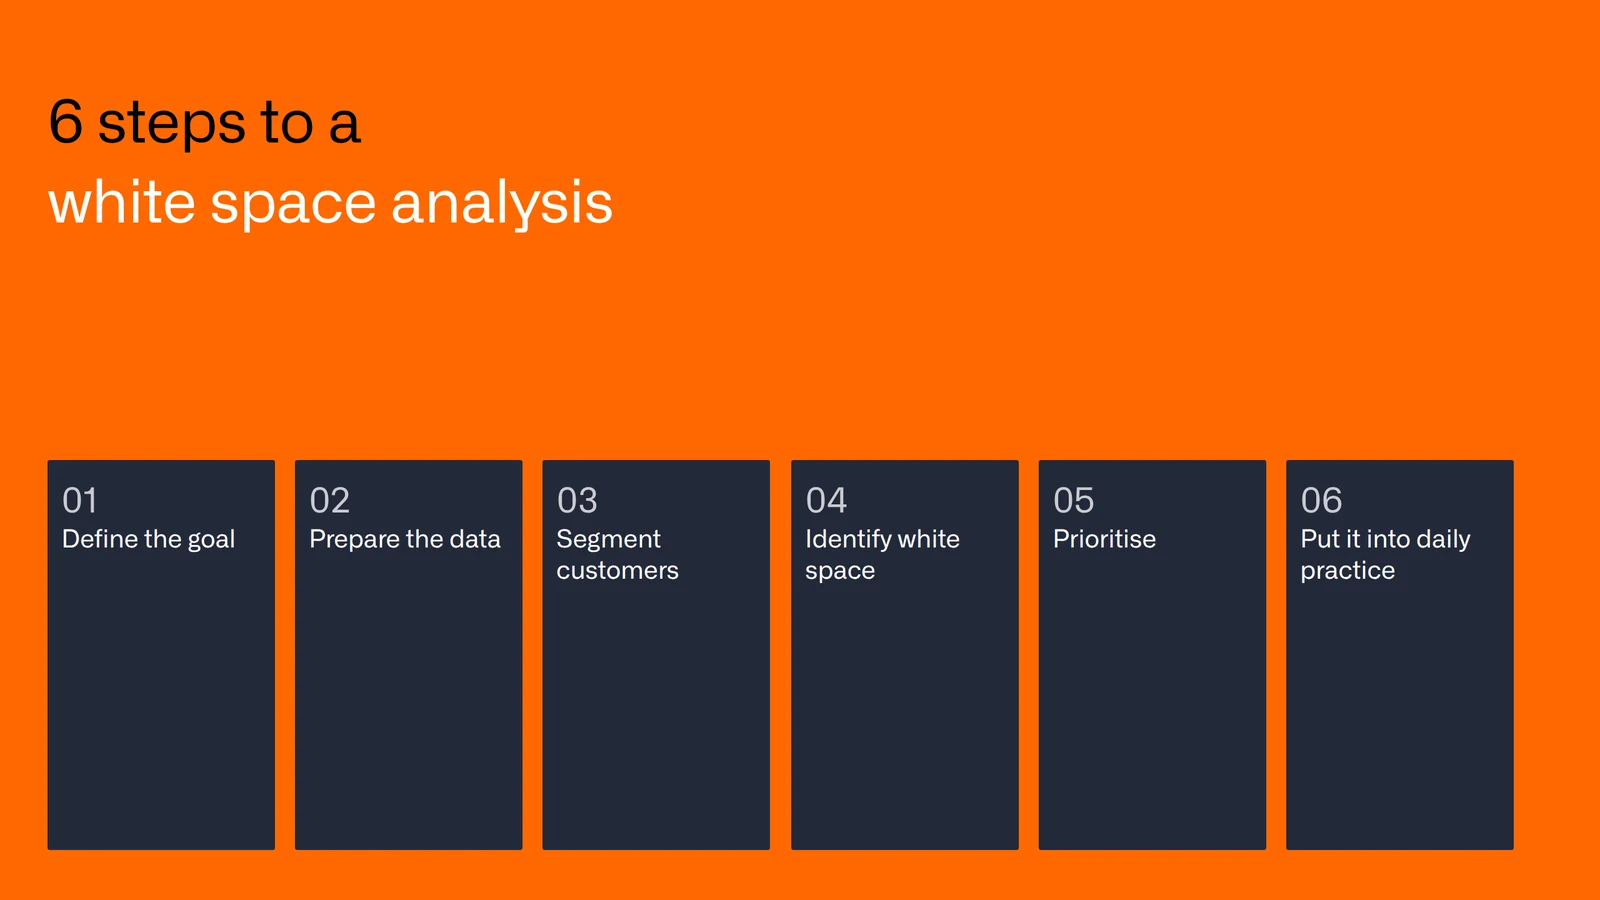
The basic structure is well established in the literature. What is usually missing are the specifics of wholesale and distribution. Here is the process as it works in practice:
Step 1: Define the goal
What should the analysis deliver? Cross-selling potential with existing customers, regional gaps or new customer segments? The goal determines the data you need. Trying to do everything at once usually fails because of the complexity.
Step 2: Prepare the data
Prepare CRM and ERP data by category, customer industry, revenue, assortment breadth and visit history. An honest rule of thumb from practice: if more than about 30 percent of customer records are incomplete, the results are unreliable. Garbage in, garbage out.
Step 3: Segment customers
Group customers into clusters by current contribution margin and estimated potential. Contribution margin is a more honest indicator for setting priorities than revenue alone.
Step 4: Identify white space
Which customers, regions or assortment areas are systematically below expectations? The matrix from step 3 makes this visible. White space is where potential is high and current contribution margin is low.
Step 5: Prioritise
Not all white space is equally valuable. Define the 20 customers or segments with the highest potential you can realistically capture. Less is more.
Step 6: Put it into daily practice
This is the step where most analyses fail. A white space analysis that ends up in a folder is worthless. Field sales needs the findings before every customer visit, in the form of a concrete recommendation. A PowerPoint slide in a shared folder never reaches the rep in time.
This is where classic analysis projects hit their limits: white space analysis has to be translated from a strategic framework into daily visit planning. Acto continuously reads CRM and ERP data and proactively shows field reps which customers to visit next, based on the same potential logic that a one-off white space analysis uncovers. See also: next best action in B2B sales.
Examples: white space analysis in wholesale
The first two examples are typical scenarios, anonymised and simplified. The third is based on published customer results.
Example 1: Industrial distributor (assortment)
An industrial supplies distributor analyses the depth of each customer's assortment. Result: a considerable share of customers buy only consumables (grinding discs, protective equipment, small parts), but never tools and machines, even though the same customers buy in comparable categories from competitors. The cross-selling initiative gives field reps a concrete recommendation for these customers before the next visit. That is the typical outcome of an assortment-based white space analysis.
Example 2: Pharmaceutical wholesaler (regional)
A regional pharmaceutical wholesaler compares its market penetration by postcode area with pharmacy density. In one metropolitan area, its penetration rate is clearly below that of comparable regions. A field sales push with personalised offers targets exactly this region. That is the classic outcome of a regional white space analysis.
Example 3: Systematic account development with documented results
Böllhoff, a specialist in fastening technology, achieved 8.6 percent revenue growth in a controlled A/B test with Acto. Schäfer Shop, a mail-order and online supplier of office and business equipment, increased revenue by 11.2 percent. The underlying logic is the same as in a white space analysis:
Which customer is buying below their potential, and what does the field rep need to change that?
White space analysis and AI: from annual project to continuous intelligence
The classic white space analysis is a project. You commission it, get results, work through the list, and a year later it all starts again. That is no longer enough.
Data-based customer segmentation by margin, potential and cross-selling opportunities helps focus sales activity. The next step: AI-based systems apply the same logic, potential versus current contribution margin, continuously and automatically to CRM and ERP data.
The difference in practice is considerable. Instead of an analysis every 12 months, field reps get up-to-date signals every day: customer X has cut their spend in category A by 30 percent, a possible churn signal (see preventing customer churn). Customer Y regularly buys in categories A and B, but never in C, even though their industry profile clearly points to demand for C. Detected as it happens, without the field rep needing analyst skills.
Predictive analytics in wholesale is the technical evolution of white space analysis: a concrete recommendation right before the customer meeting, with no dashboard that field reps have to interpret themselves. How recommendation logic works in detail is covered in our article on recommender systems in B2B sales.
How to use white space insights in day-to-day field sales with Acto
Analysis without execution is worthless. Here is how white space insights move from a report into a field rep's Monday morning.
Visit planning and prioritisation
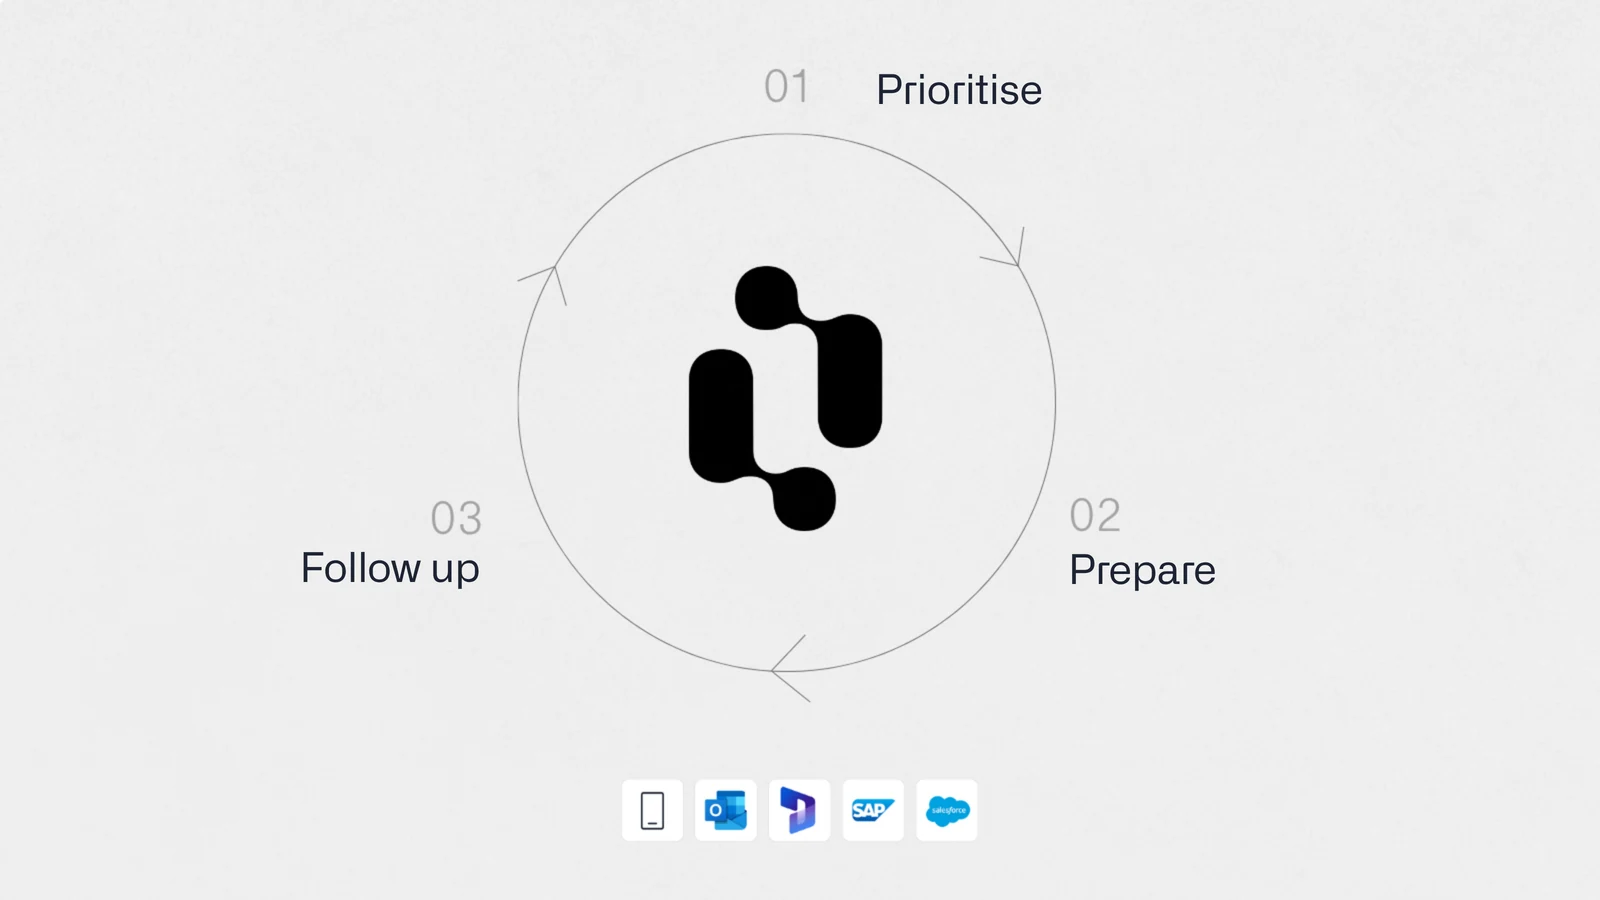
Which 10 customers should be visited this week? The coffee should not decide. The list should contain the customers showing a cross-selling signal, whose revenue has dropped unexpectedly, or who are clearly not using their potential. Acto prioritises the visit list automatically and recalculates it every day based on ERP data. That is data-driven steering of visit frequency in practice. Which metrics help with that is covered in our article on field sales KPIs.
Visit preparation
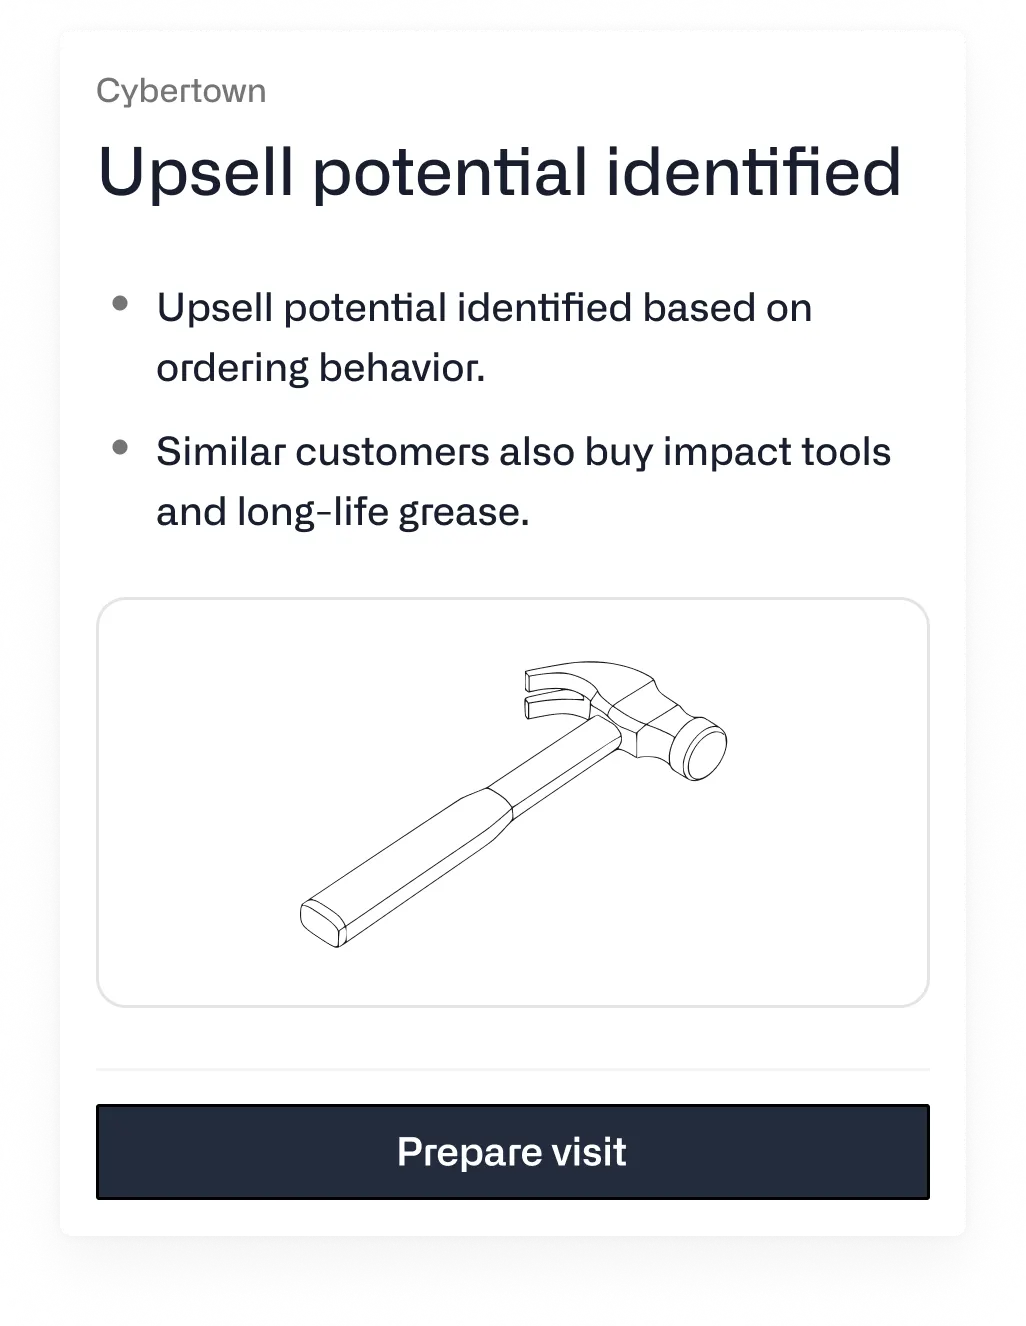
The field rep drives to the customer already knowing: this customer buys categories A and B, but has never ordered category C, although it is standard in their industry. The conversation is prepared before the first coffee is poured. Acto puts this briefing together in about two minutes, in the Acto app and, if you like, directly in Outlook.
Follow-up without paperwork
What was discussed with the customer? Which white space topics came up, and how did the customer react? The field rep sums it up in a short voice note right after the meeting, and Acto creates the CRM note automatically. What goes into the report feeds into the next prioritisation. At Plate, Acto saves 1 to 1.5 hours per day. That is time that goes into customer visits that were not on the agenda before, exactly the white space the analysis identified. More on this: voice to CRM and our free sales visit report template.
Want to know which customer potential is hidden in your CRM and ERP data? In a short demo, we show you how Acto continuously uncovers white space in your existing customer base: Book a demo
When does white space analysis not work?
There are four situations in which this approach fails or delivers no value.
1. Poor data quality
Wrong priorities are worse than no priorities, because they steer resources in the wrong direction. Before you start a white space analysis, you need an honest assessment of your data quality. This also applies to AI-based systems: they need clean input data.
2. No willingness to act
If the findings are not translated into changed visit routines, adjusted territory responsibilities or concrete cross-selling initiatives, the analysis is an expensive confirmation of the status quo. In many companies, white space analysis ends with a management presentation and three weeks of enthusiasm. Then day-to-day business wins.
3. Too narrow an assortment
If you sell three products, you do not need an assortment-based white space analysis. The approach only pays off once your range is broad enough for real cross-selling, as a rule of thumb at least five to eight relevant product categories with genuine overlap in the target group.
4. Field sales not involved
A top-down analysis presented to sales without explaining the method will not be believed and will not be acted on. Field reps have years of customer experience. That experience and the data need to work together. Change management is a prerequisite. Our article on account management in B2B covers how to embed this in daily work.
FAQ: white space analysis in wholesale
What is the difference between white space analysis and market potential analysis?
A market potential analysis answers the question: how big is the total market I could theoretically address? A white space analysis goes one step further and asks: which specific parts of it am I not yet capturing, by region, assortment or customer? It is more precise, more action-oriented and delivers findings you can prioritise directly.
Is white spot analysis the same as white space analysis?
Yes. "White spot analysis" is the term commonly used in German-speaking countries, often with a geographic focus. In English, "white space analysis" is more common and is used for regions, products and customers alike.
What data do I need for a white space analysis in wholesale?
Minimum: purchase history by product category, customer industry (e.g. NACE or NAICS code), revenue and contribution margin per customer, and visit history from the CRM. For the regional dimension, add external market data (company registers, industry statistics). The more complete the data, the more precise the results, and the less room there is for subjective prioritisation.
What does a white space analysis cost?
It depends heavily on scope and data. As a rough guide, external consulting projects can range from a few thousand to several tens of thousands of euros. With internal resources (Excel, standard CRM reports), a first version is possible with a few days of work. Do the maths for your own case: if, for example, 10 out of 50 identified white space customers start buying a cross-selling product, how quickly does the additional margin cover the effort?
How often should you run a white space analysis?
Once a year as a strategic project is the minimum. Better is continuous monitoring with data-driven sales tools that pull signals from CRM and ERP data as they arise. White space analysis should become a recurring part of sales and marketing planning, or be replaced by a system that automates this logic permanently.
How do I find untapped customer potential without a big analysis budget?
Start with a simple ABC analysis combined with an assortment depth analysis per customer. In practice: which A-customers buy from only one of your three main categories, even though their industry profile makes all three relevant? That overlap is your first low-cost white space report. Tools: Excel or the standard reporting functions of your ERP system.
White space analysis works best as a way of thinking rather than a one-off project. If you want to run sales on data in the long term, ask about untapped potential before every customer meeting instead of once a year.
The data for this is already in your CRM and ERP. The question is whether anyone analyses it, and whether the findings actually reach field sales before the next appointment starts.
Book a demo and we will show you which white space is hidden in your existing customer data.