Share of Wallet in B2B Sales
.png)
Summary
- The core idea: what counts is your share of the customer's total budget, beyond your own revenue. Sell 200k euros while 2 million euros goes elsewhere, and you are losing to competitors.
- Prioritisation: visit customers by potential rather than revenue history. A "small" customer at 10 percent share of wallet can be worth more than a "large" one at 90 percent.
- Early warning: a falling share of wallet signals churn before absolute revenue drops, and targeted cross-selling closes the gaps the customer currently fills elsewhere.
A customer with 200,000 euros of annual revenue can be a C-customer, if their total purchasing budget in the relevant category is 2 million euros and 90 percent of it goes to a competitor. Conversely, an existing customer with 50,000 euros of revenue can hold the biggest growth potential in the entire sales territory, if only the field team approached them deliberately.
Share of wallet closes exactly this gap.
Used well, it is far more than an abstract idea from a strategy report. It becomes a steering metric that decides whom the field team visits, when, and what they talk about.
If you measure share of wallet (SOW) systematically and build it into daily sales work, you can grow from your existing customer base without winning a single new account.
According to McKinsey, B2B companies that use data and analytics systematically in their commercial organisation achieve above-market growth and an EBITDA increase of 15 to 25 percent (McKinsey: Insights to impact, 2022). That edge comes from better day-to-day sales decisions, and share of wallet is one of their foundations.
1. What is share of wallet, and how is it different from market share?
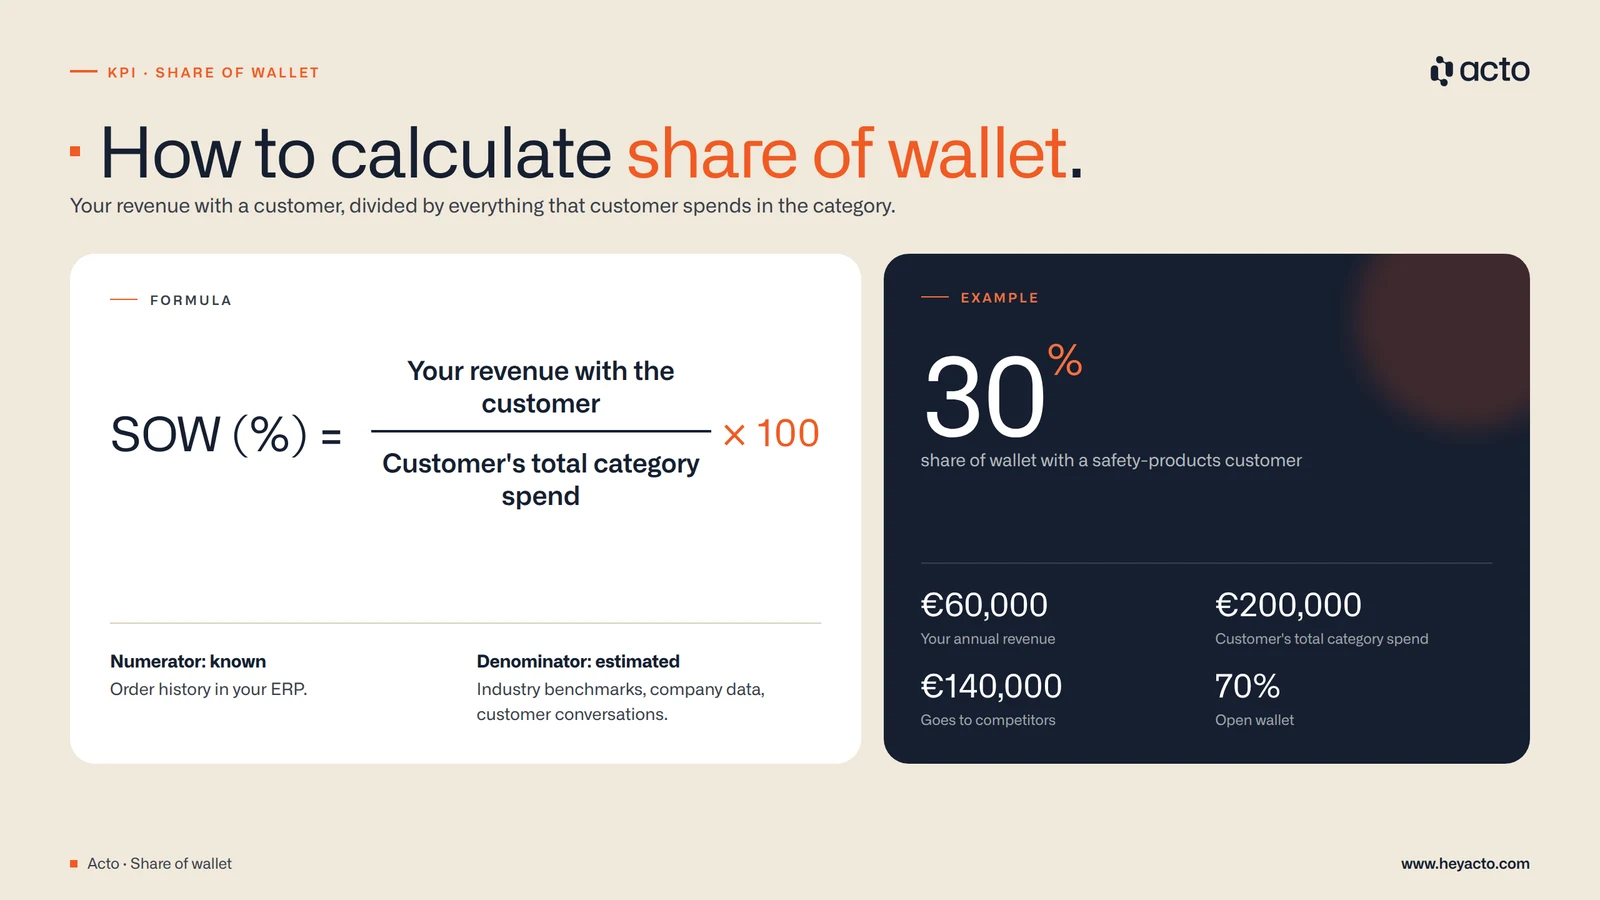
Share of wallet describes the percentage of a specific customer's total purchasing budget in a product category that goes to your company.
The formula is simple:
Share of wallet (%) = Your revenue with the customer / Customer's total purchasing budget in the category × 100
A distributor of safety products that sells 60,000 euros a year to its customer Bauer & Sons has a share of wallet of 30 percent with that customer, provided Bauer & Sons spends a total of 200,000 euros a year on products in this segment. The remaining 70 percent goes to competitors.
The key difference from market share:
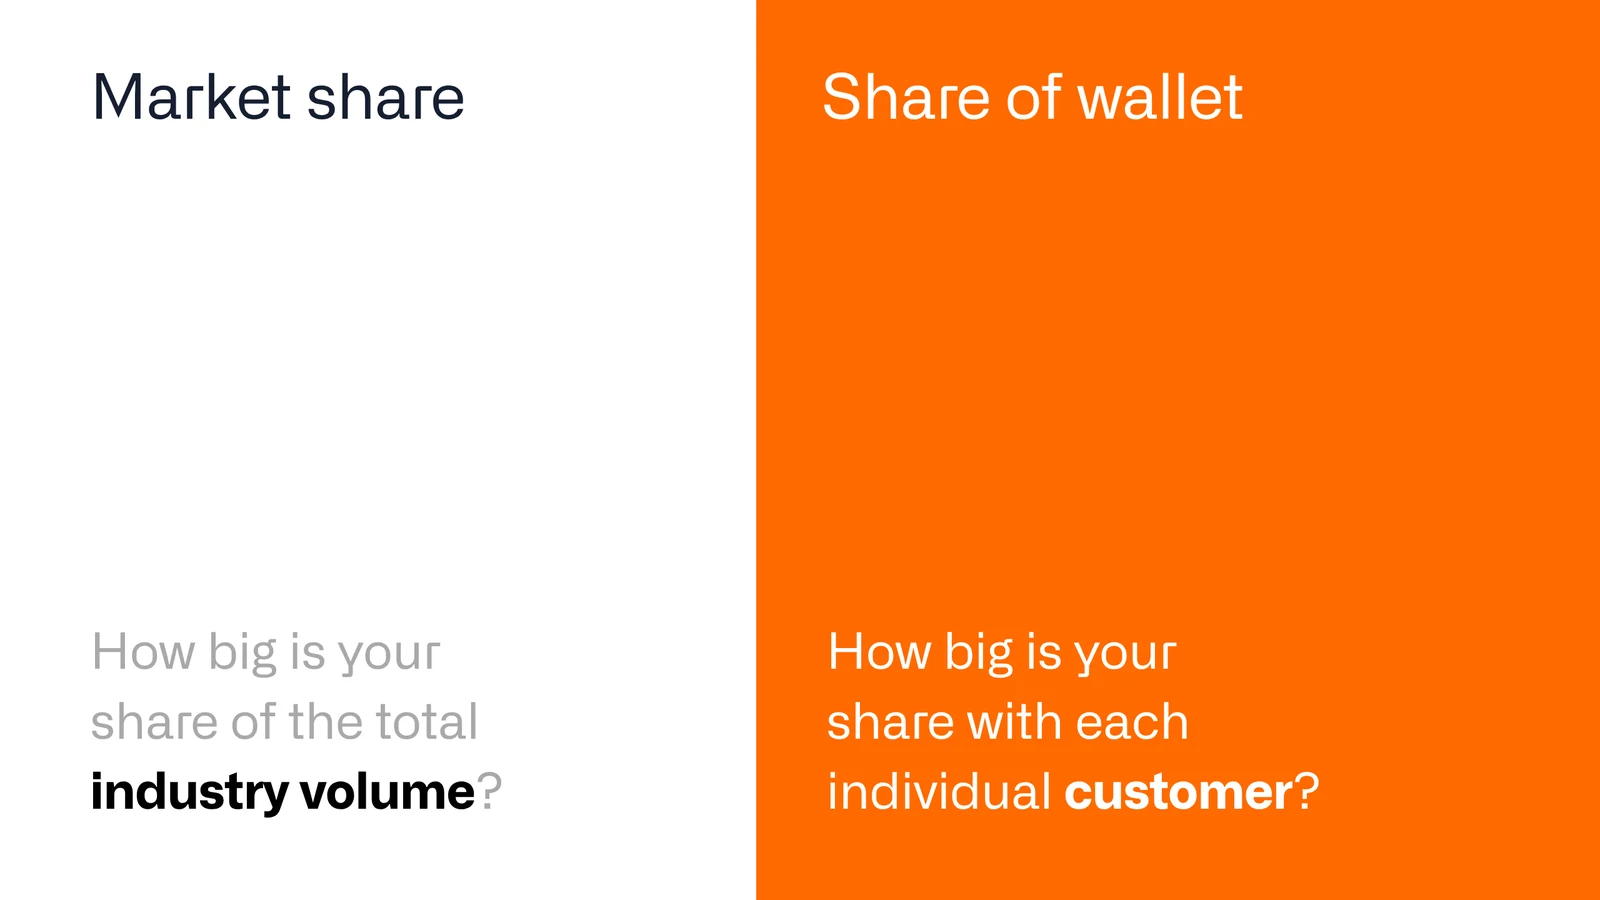
Market share is a market metric. It tells you how large your share of the total industry volume is.
Share of wallet is a customer metric. It tells you how deeply you are anchored with an individual customer.
Companies with a high market share can still have very low share of wallet with their most important customers. This happens every day in wholesale and distribution organisations that rate their customer base by revenue rather than by potential.
In B2B, share of wallet is therefore the more relevant growth metric:
- Market share is won through expensive new customer acquisition.
- Share of wallet is won by working better with customers who already buy from you, already trust you and already have a supply relationship with you.
Those three advantages make the difference in acquisition efficiency. More on the economics in our article on new vs. existing clients.
2. Why share of wallet is a blind spot in most sales organisations
Share of wallet does not appear in any standard ERP report. If you don't know a customer's purchasing budget, you can't know what share of it you are winning. That is the structural problem: the revenue data on your own side is complete in the ERP, but the other side, the customer's total budget, usually stays invisible.
The result is a systematic error in sales steering: teams prioritise by current revenue. Whoever buys a lot gets a lot of attention. Whoever buys little is rarely visited. The logic is understandable, but it regularly produces the wrong priorities.
Example: Bain & Company describes a distribution company that analysed share of wallet using trade association data and a quick survey of where its reps spent their time (Bain: Is that customer worth your time?). It found a close link between rep time and share of wallet, and many medium-sized accounts with ample growth potential but little field coverage, because they had historically been too small to get the reps' attention. More than 70 percent of customers surveyed said more interaction would lead them to buy more. The company then increased the number of conversations with target accounts two- to threefold.
2.1 The small-customer paradox
"Ignore your C-customers and you often ignore your future A-customers. Your competitors will be glad of the invitation."
A typical pattern in wholesale makes the problem worse: in many portfolios, the majority of accounts are small customers with low current revenue, and they get little field sales attention as a result. Yet these are often exactly the customers where your share of wallet is lowest, and the relative growth potential is therefore highest.
A key account with 2 million euros of annual revenue where the field team already holds 75 percent share of wallet has limited upside, and the remaining 25 percent is fiercely contested. A B-customer with 150,000 euros of annual revenue and a share of wallet of 15 percent, by contrast, has a total wallet of around 1 million euros, almost seven times what you sell there today (example calculation). This calculation is rarely done, simply because the customer's total budget is unknown.
This is one of the strongest growth levers in wholesale: the systematic development of customers with low revenue and high potential, rather than a fight for the last percentage point with saturated top accounts. If you don't know who they are, you leave them aside. Our article on potential-based selling shows how to reorganise coverage around them.
3. How to calculate share of wallet with the data you already have
The main challenge in calculating share of wallet: your own revenue is known, the customer's total budget is not. Without external data or a direct conversation with the customer, the denominator of the formula remains an estimate. Still, there are practical ways to estimate share of wallet across your portfolio that are good enough to set priorities.
3.1 Estimating potential with external data
There are three common approaches for a sound potential estimate at customer level.
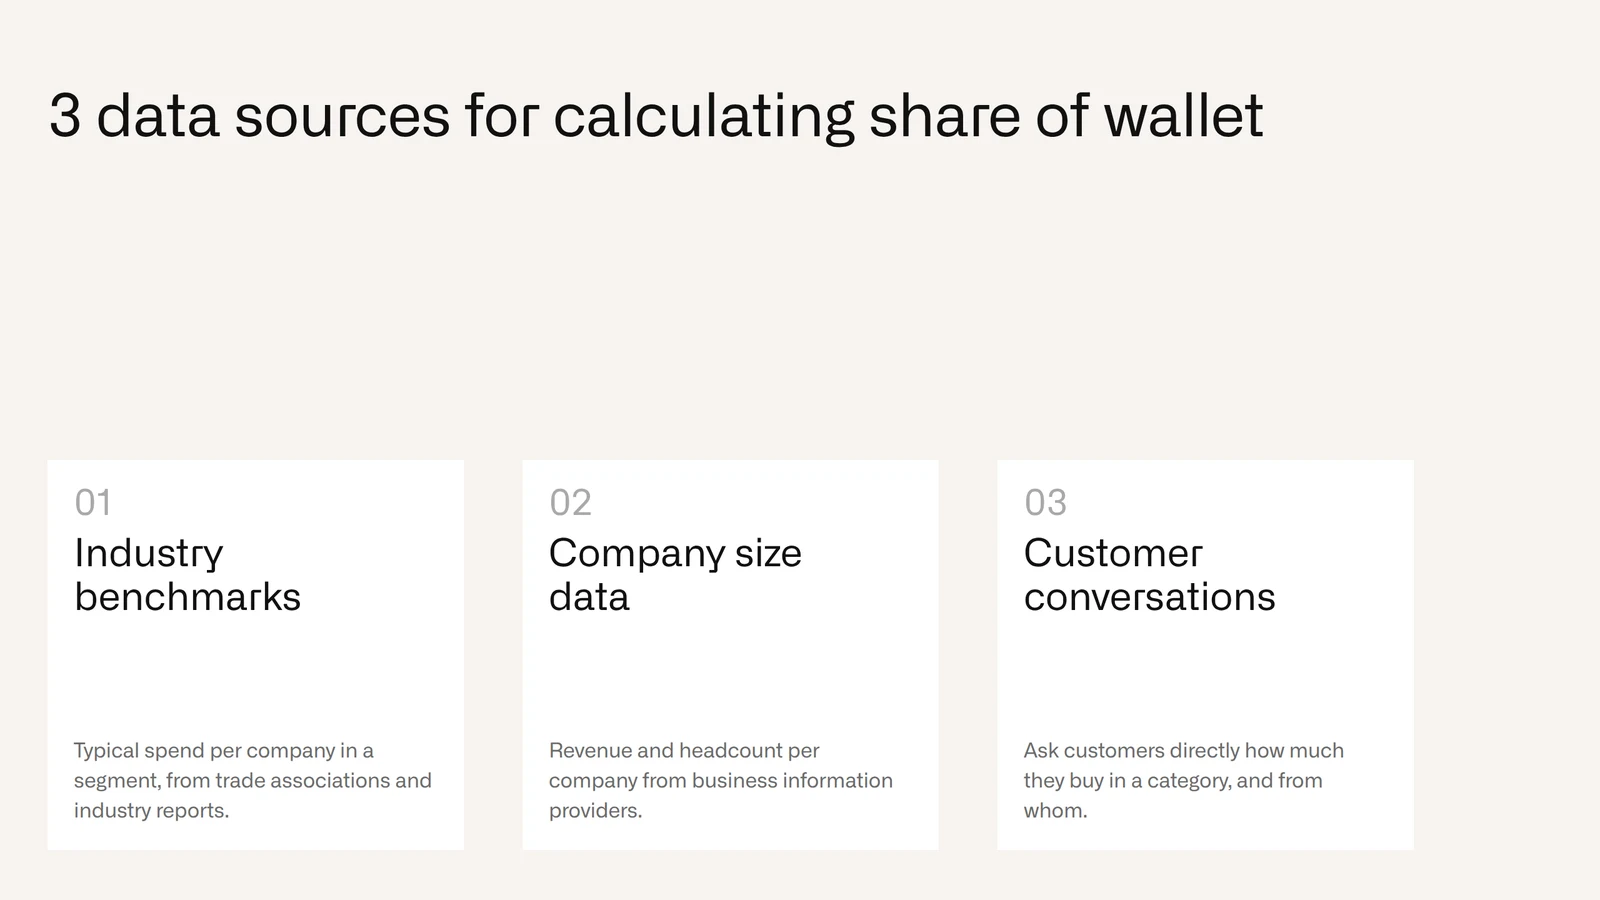
First: use industry benchmarks. If you know that a restaurant with 20 employees spends, on average, a certain amount per year with food wholesalers, you can extrapolate the potential of that segment.
Data from trade associations, such as the German wholesale federation BGA or industry associations in your market, and sector reports provide reference values here.
Second: company size data. Business information providers such as Dun & Bradstreet, Creditreform or Moody's Orbis (formerly Bureau van Dijk) supply revenue and headcount at company level, from which you can estimate purchasing budgets in specific categories.
Third: talk to the customer directly. Many sales organisations underestimate how openly customers discuss their purchasing volumes, especially when the rep raises the topic professionally and shows what the customer gains from it.
3.2 The four-field matrix as a starting point
Even without precise potential estimates, a simple four-field matrix gives you a first orientation on share of wallet.
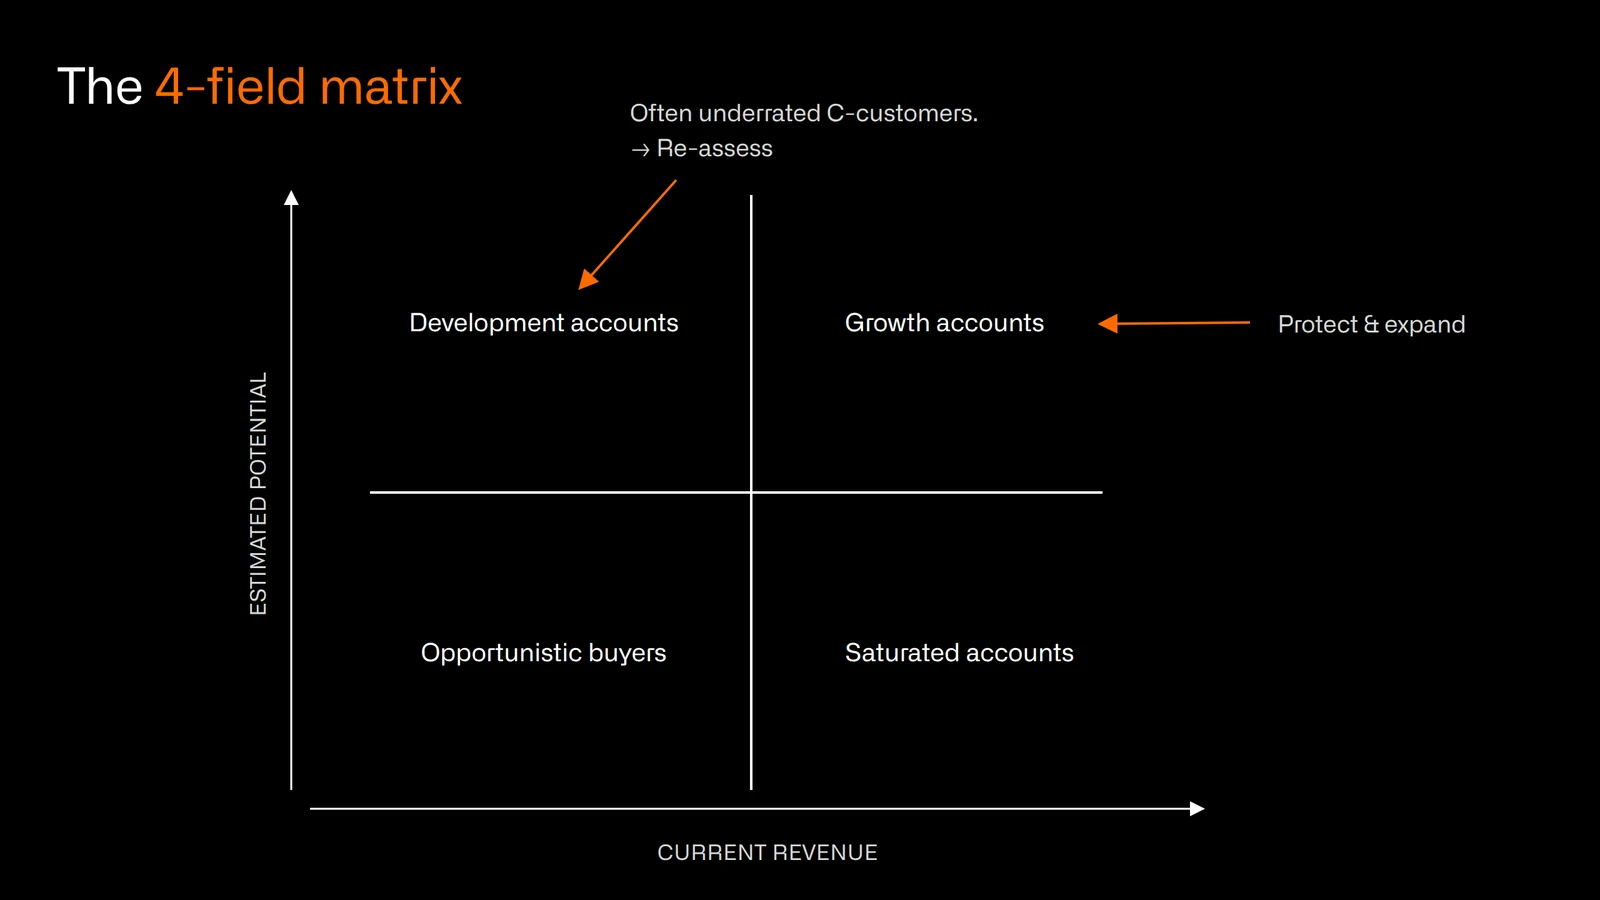
The axes: current revenue (low/high) and estimated potential (low/high).
| Quadrant | Current revenue | Estimated potential | Typical share of wallet | Field sales focus |
|---|---|---|---|---|
| Development accounts | Low | High | Low | Re-assess, visit more, raise missing categories |
| Growth accounts | High | High | Medium | Protect and expand, regular range reviews |
| Saturated accounts | High | Low | High | Retain, watch for declining share |
| Opportunistic buyers | Low | Low | Varies | Inside sales or digital channels |
Customers in the "low revenue, high potential" quadrant are the classic share of wallet opportunities. They buy little but could buy a lot.
Customers in the "high revenue, high potential" quadrant are the large accounts you need to protect, with depth still to be developed. This segmentation needs no major data investment, yet it changes visit planning fundamentally. If you want to go one level deeper and see which product groups are missing per customer, a white space analysis is the next step.
3.3 Predictive analytics for automated share of wallet scores
For wholesale organisations with several thousand customers, manual estimation does not scale. This is where AI-based data analysis comes in: the system combines your own order history from the ERP with external company data and calculates an automated share of wallet score for each customer. The score answers a different question from "How much does the customer buy?". It asks "How much could the customer buy, and how much of it goes to competitors?"
The result is a customer list sorted by potential that updates daily. Customers whose potential rises, because they grow, open new sites or their industry booms, move up the priority list automatically. Customers whose potential falls are handled accordingly.
4. Share of wallet as a steering tool for field sales
A share of wallet score in a back-end system is of little use if it does not flow into daily sales work.
The value only appears once reps plan their week by a priority list that combines potential and current supplier share, instead of by habit or revenue history.
The operational consequence is direct:
A rep who today visits a customer with 800,000 euros of annual revenue, where share of wallet is already 80 percent, gains little. The same rep visiting a customer with 100,000 euros of revenue and an estimated share of wallet of 12 percent, and steering the conversation towards the missing categories, can trigger more incremental revenue in a single visit than in a dozen routine appointments with the saturated key account.
The logic is simple. Most teams still don't follow it, because the data needed for it is missing in daily work.
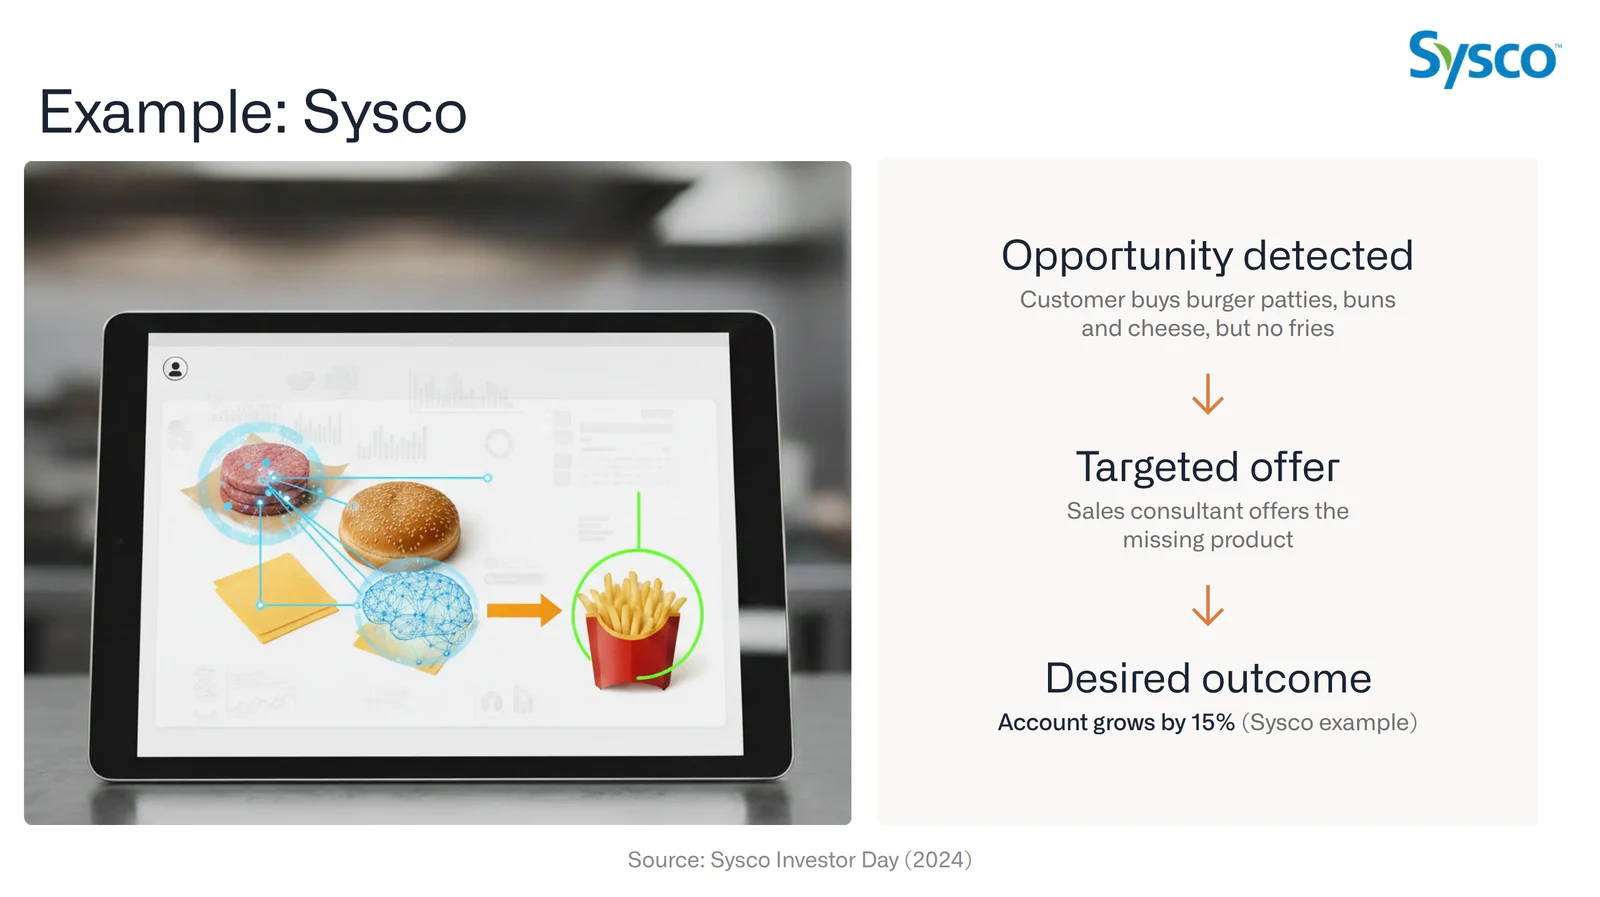
Example: Sysco, the world's largest foodservice distributor, built a digital personalisation programme that uses customer-level purchase history to tailor promotions, product recommendations and insights for its sales consultants, including which products and categories a customer does not yet buy. According to Sysco, the programme had generated 450 million dollars in incremental sales to date by its 2024 Investor Day (Sysco Investor Day 2024; also reported by Digital Commerce 360). The programme combines digital channels such as e-commerce and email with the work of the field sales consultants.
The most important shift is conceptual:
Modern sales steering stops asking "Who buys the most?" and asks "Where is the largest untapped potential?"
Share of wallet is the metric that answers this question.
5. Cross-selling as the main lever for growing share of wallet
If you know that a customer spends only 20 percent of their budget in a category with you, the next question answers itself: what do they buy with the other 80 percent, and where? In most cases these are product categories your range already covers, but that were never actively raised. Cross-selling driven by share of wallet analysis is therefore a direct answer to a known gap, far from a random upsell pitch.
That is what sets it apart from the classic "Is there anything else I can offer you?". Instead of suggesting new categories at random, the rep raises precisely those areas where the customer clearly already buys, only somewhere else. The conversation changes fundamentally. It moves away from the supplier's range and towards the customer's needs.
5.1 Basket analysis as a data-driven basis for cross-selling
For wholesalers with broad ranges, basket analysis (market basket analysis) provides a particularly effective basis for share of wallet driven cross-selling. The system analyses which product categories typical customers of a given type buy together, and then identifies the customers for whom that combination is still incomplete.
The model uses collaborative filtering: it compares each customer's purchasing portfolio with that of their peer group, meaning similar industry, similar company size and similar purchase volume. Categories that most peer customers already buy but the target customer does not are flagged as prioritised cross-selling candidates. In an illustrative example, the rep might see: "Weber Ltd regularly buys fasteners and tools. 78 percent of its peer customers also buy workplace safety products. Weber currently does not buy them from us.
Recommended topic: PPE range, estimated annual potential: 8,400 euros."
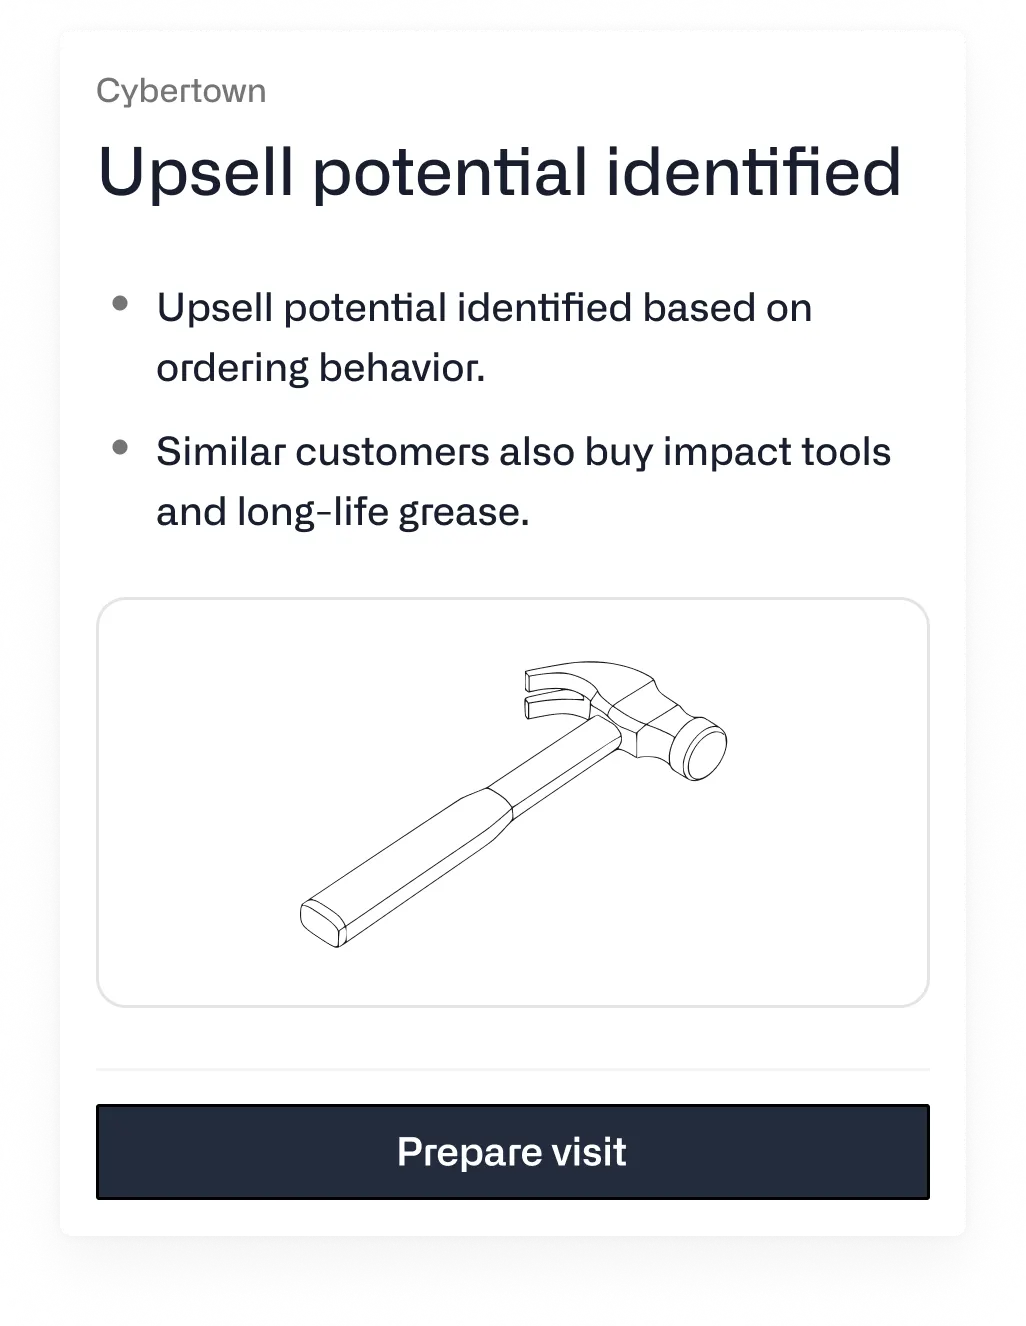
This level of detail is no magic. It requires ERP data, a segmentation model and a technical connection to the field sales interface. With these three components, you replace the gut-feeling conversation with a data-driven sales conversation and grow share of wallet step by step in every single category. More on this in our article on upselling in wholesale.
6. Share of wallet and churn prevention: the underrated connection
Most discussions of share of wallet focus on growth: how do you win a bigger share? But share of wallet has a second, often overlooked function. It is an early warning system for churn.
A customer who reduces their supplier share with you rarely does so abruptly.
They first buy less in one category, try another supplier for a sub-segment, find that it works, and gradually expand the competitor's share. By the time this becomes visible, it is often well advanced. Total revenue only drops noticeably at the end of this process.
Share of wallet monitoring picks up this movement earlier: if a rep sees that a customer who usually spends 30 percent of their budget with them has dropped to 18 percent over the last three months, that is a warning sign long before absolute revenue collapses. Churn early warning systems based on RFM analysis (recency, frequency, monetary value) can detect these movements automatically and translate them into concrete visit priorities, for example:
"Customer Schneider Inc. shows a significant decline in share of wallet in the cleaning category for 6 weeks. High churn probability. Recommended action: get in touch and discuss alternative products."
The economics make this connection especially relevant. As Harvard Business Review summarises, acquiring a new customer is anywhere from five to 25 times more expensive than retaining an existing one (HBR: The value of keeping the right customers).
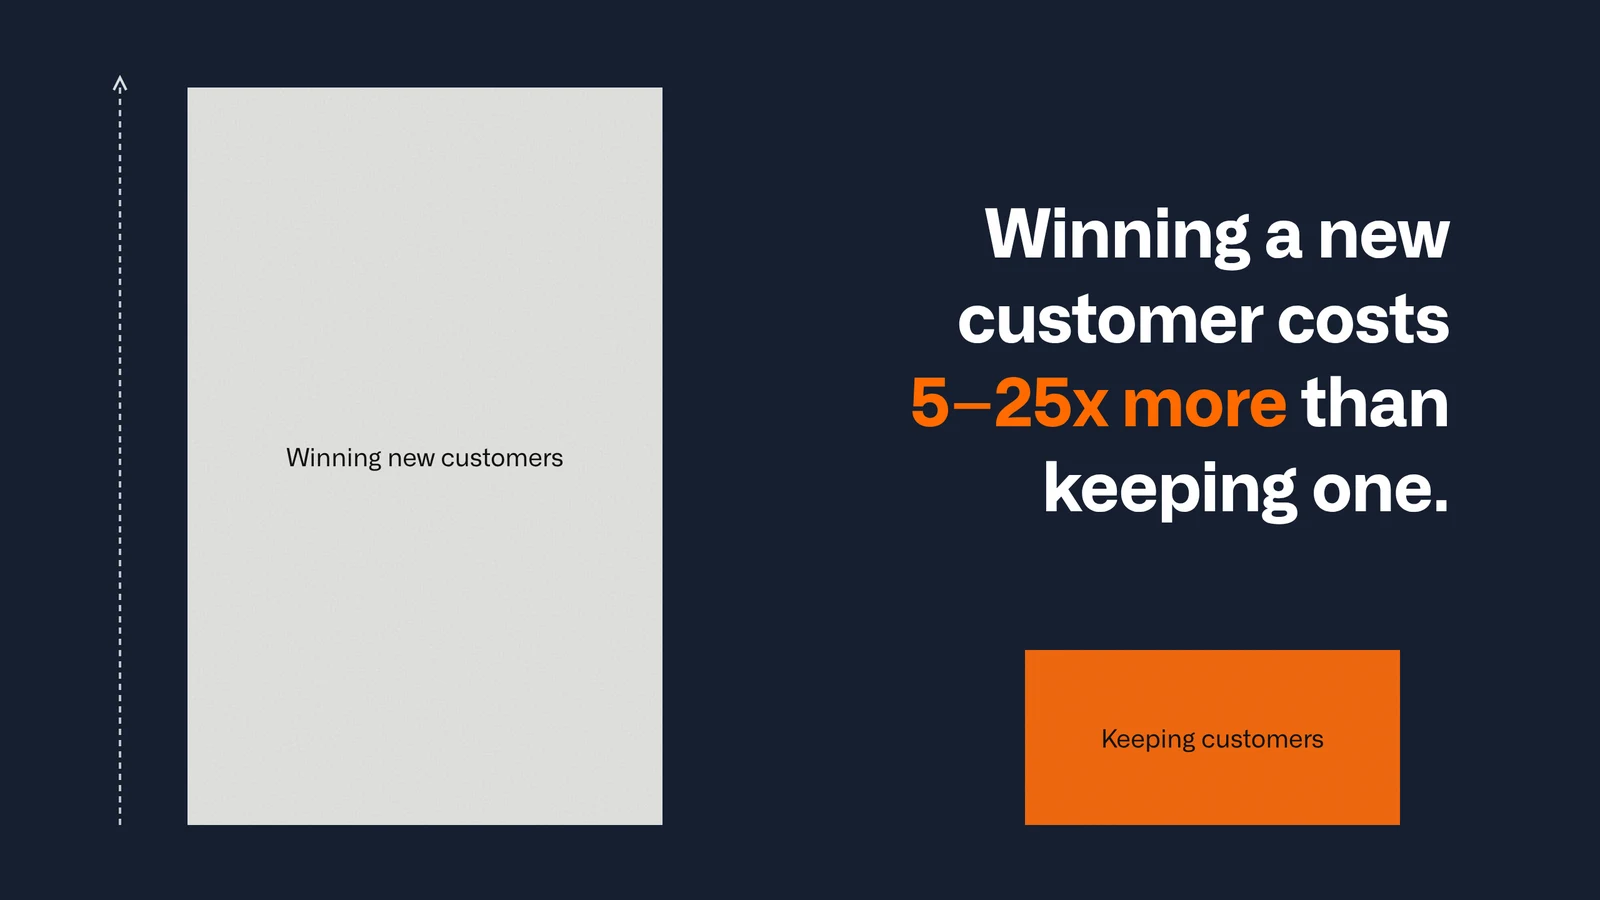
Research by Frederick Reichheld of Bain & Company, cited in the same HBR article, found that increasing customer retention rates by 5 percent increases profits by 25 to 95 percent. If you don't spot share of wallet declines early, you pay the difference later through expensive new customer acquisition.
Example: METRO AG has made a stronger focus on its core customer groups (HoReCa and traders) a pillar of its sCore strategy, including more than 700 new sales positions created in the 2023/24 financial year (METRO Annual Report 2023/24).
According to METRO, the share of sales with these strategic customers rose to 76 percent in 2023/24, up from 74 percent the year before and 66 percent before sCore was introduced. Over the same period, the digital sales share rose from 11 to 14 percent (METRO newsroom). METRO does not report share of wallet directly, but the figures show the direction: more coverage for the customers who matter most, and more of their purchasing running through METRO's own channels.
7. How Acto builds share of wallet into daily field sales steering
Share of wallet remains a concept until it is translated into the rep's actual working day.
The challenge: a typical wholesale rep looks after hundreds of accounts, often 300 to 1,000. Even reps who understand the concept have no time to estimate share of wallet manually for every customer, identify the gaps and derive visit recommendations. Without technical support, share of wallet steering remains a management idea with no operational effect.
Acto analyses ERP order histories and CRM data and compares every customer with similar customers. It detects declining revenue and orders, products that drop out of the basket, missed repurchases and cross-selling clusters, and turns them into visit priorities: when reps open their weekly list on Monday morning, they see which customers to visit, why, and what to focus the conversation on. For customers with a low share in a particular category, the meeting brief contains concrete cross-selling recommendations at product level. The brief is ready in about two minutes, in the Acto app and in Outlook.
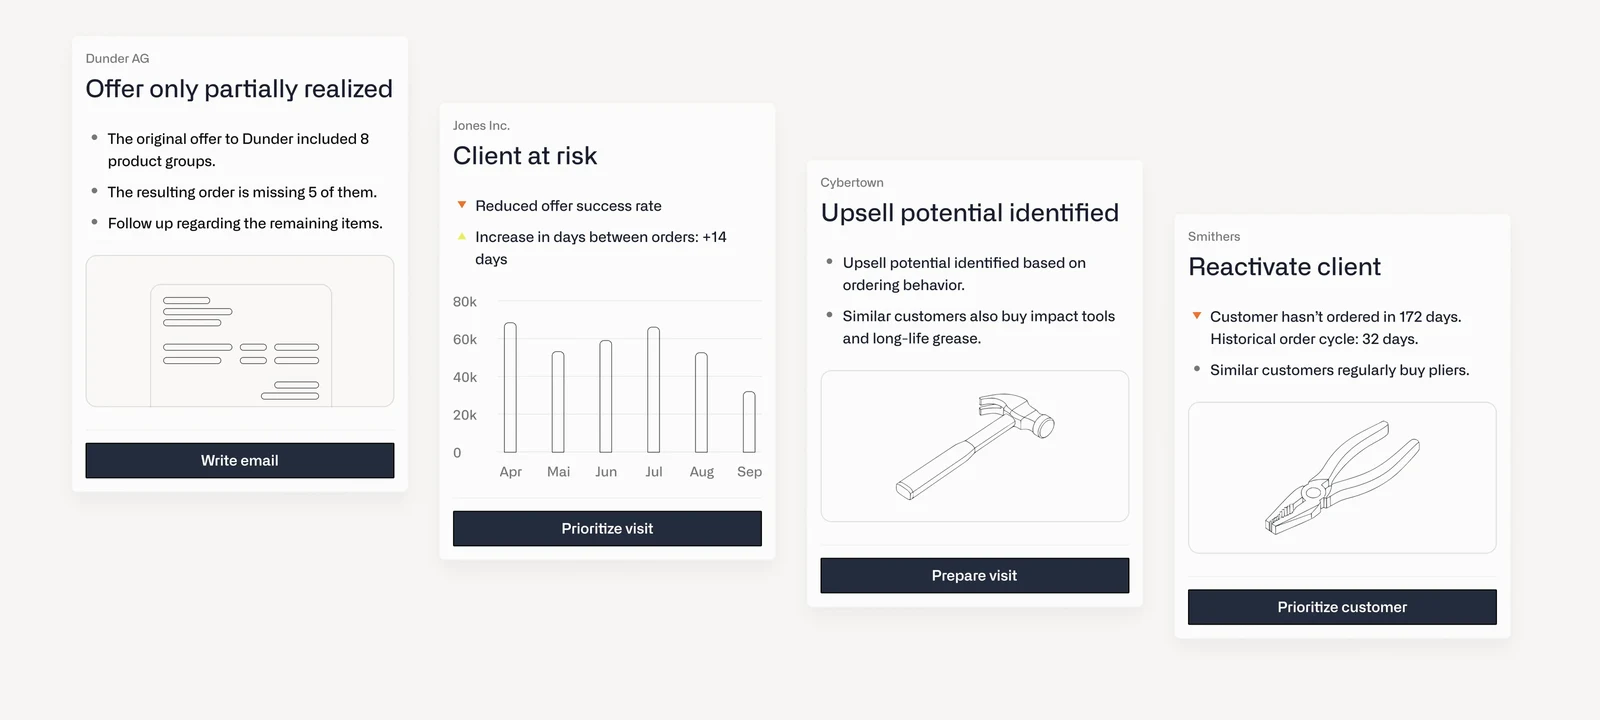
In controlled A/B tests, Böllhoff achieved +8.6 percent revenue and Schäfer Shop +11.2 percent revenue with Acto. Reps marked 92 percent of the signals as helpful. Read more about growing existing customers in B2B.
Conclusion
Share of wallet is no esoteric metric from a strategy report.
It answers a very concrete question: what share of your customers' purchasing budget do you actually win, and how much do you leave to competitors? Companies that can answer this question make better decisions about whom the field team visits, what they talk about and where the next growth step lies.
Growing existing customers is the most cost-efficient growth path in B2B wholesale. Share of wallet makes it visible and steerable. Ignore it, and you leave revenue to competitors, often without even knowing it.
Curious how Acto makes your field team's share of wallet visible and builds it straight into visit planning?
Book a free demo with our team.
FAQ: share of wallet in B2B
What is a good share of wallet in B2B?
There is no universal benchmark, because it depends on the industry, the breadth of your range and how many suppliers customers typically use. More useful than an absolute target is the comparison within your own portfolio: customers with high potential and low share of wallet are your biggest growth opportunity.
How do I estimate a customer's total budget?
Combine three sources: industry benchmarks (typical spend per company in a segment), company size data from business information providers, and direct conversations with the customer. A rough estimate is enough to start setting priorities and gets more precise with every visit.
What is the difference between share of wallet and market share?
Market share measures your share of total industry volume. Share of wallet measures your share of an individual customer's spending in a category. You can have a high market share and still a low share of wallet with important customers.
How does share of wallet help prevent churn?
Customers usually move spend to competitors step by step, one category at a time. A falling share of wallet shows this shift before total revenue drops noticeably, which gives the field team time to act.
Do I need software to manage share of wallet?
For a few dozen customers, a spreadsheet and a four-field matrix are enough. With hundreds of accounts per rep and thousands of products, manual upkeep does not scale, and an analysis of ERP data that updates automatically becomes necessary.