B2B Sales Statistics: Verified Figures with Sources

Summary
- According to Salesforce, sales professionals spend 40% of their working time selling (State of Sales, 7th edition, 4,050 respondents in 22 countries, surveyed in 2025).
- According to Gartner, 67% of B2B buyers prefer buying without a sales rep, yet 69% would rather check AI answers with a sales rep (surveys of 646 and 645 buyers respectively, 2025).
- In Ebsta's platform data, expansion deals with existing customers are won 45% of the time, new business 19% of the time (2024 data).
- The claim "80% of deals close after the 5th to 12th contact" traces back to a 1942 survey with fewer than 40 respondents and should be cut from every slide deck.
1942, fewer than 40 respondents: one of the most widely quoted sales statistics traces back to a member survey run by a regional sales executives' association. It claims that 80% of all deals close after the fifth to twelfth contact. This page collects B2B sales statistics for sales leaders, executives and editors. Every figure comes with its publisher, year and base, and every one links to the primary source.
You're welcome to reuse the figures and charts with a link back to this page.
A sales figure is only as solid as the way it was measured.
Once you know the publisher, year and base, you can use sales statistics with confidence in a budget request, a strategy paper or an article. The reliable figures then point to two places where revenue gets left on the table: the time reps spend away from customers, and business with existing customers.
Key B2B sales figures at a glance
Each of the following statements can be quoted on its own. Vendor platform data is labelled as such.
- Sales professionals spend 40% of their working time selling, according to the 7th edition of Salesforce's State of Sales (survey by a CRM vendor, 4,050 respondents, 2025).
- According to Ebsta platform data, reps spend only 21% of their day in contact with customers; top performers spend nearly half (Ebsta × Pavilion, 2025 GTM Benchmarks, 2024 data).
- According to Forrester, an average of 13 people are involved in a B2B purchase decision (State of Business Buying 2024).
- According to Forrester, 86% of B2B purchases stall during the buying process (2024).
- 67% of B2B buyers prefer buying without a sales rep, according to a Gartner survey of 646 buyers (August to September 2025).
- 69% of B2B buyers would rather check AI-generated answers with a sales rep (Gartner, 645 buyers, 2025).
- According to McKinsey B2B Pulse 2024, B2B buyers use an average of ten channels along their buying journey, up from five in 2016 (around 4,000 decision-makers in 13 countries).
- According to Ebsta platform data, expansion deals are won 45% of the time, new business 19% (2024).
- Median annual SDR attrition was 40% in 2024, according to the 10th edition of The Bridge Group's SDR report (351 B2B companies).
- 87% of sales organizations use some form of AI, according to Salesforce's State of Sales, 7th edition (surveyed in 2025).
- 26% of German companies with 10 or more employees used AI in 2025, according to the AI table published by the Federal Statistical Office (Destatis).
- 57% of German companies with 20 or more employees use AI, according to a Bitkom survey of 603 companies (2026).
How much time do sales reps spend selling?
According to Salesforce, sales professionals spend 40% of their working time selling. The figure comes from the 7th edition of State of Sales, a survey by the CRM vendor of 4,050 sales professionals in 22 countries, 250 of them in Germany, conducted in August and September 2025.
The same study provides further figures on working time:
- Non-selling work: The remaining 60% of the week goes to non-selling tasks
- Gen Z: Younger reps sell only 35% of the time and lose around two hours a week to manual data entry
- Preparation: 16% of time goes to preparation and planning
- Tools: Sales teams use eight tools on average, and 42% feel overwhelmed by them
- Feedback: 46% rarely get feedback on their sales conversations
Other studies measure "selling time" differently. That's why the three figures sit side by side and are never combined.
| Source | Type of data | Base | Year | Figure |
|---|---|---|---|---|
| Salesforce, State of Sales (7th edition) | Survey by a CRM vendor | 4,050 sales professionals, 22 countries | 2025 | 40% of working time |
| HubSpot, 2024 Sales Trends Report | Self-reported, survey by a CRM vendor | 1,400+ sales professionals, B2B and B2C, 7 countries incl. Germany | 2023 | Around 2 hrs selling, around 1 hr admin per day |
| Ebsta × Pavilion, 2025 GTM Benchmarks | Vendor platform data | 655,000 opportunities, 2,000+ CROs surveyed | 2024 | Under 2 hrs selling per day (A-players around 4), 21% of the day with customers |

Three studies, three definitions of selling time: whenever you quote a figure, say how it was measured.
For context, here's a worked example using our own arithmetic: assuming an eight-hour day, 40% selling time equals 3.2 hours. Over a five-day week, that's 16 hours of selling and 24 hours for everything else.
Time spent away from customers leaves its mark on the CRM. According to Ebsta platform data, 44% of the contacts reps talk to never make it into the CRM, and about a quarter of them are senior decision-makers. For 17% of CRM contacts, the job title or phone number is out of date. HubSpot reports that 45% of sales professionals feel overwhelmed by the number of tools in their stack.
An analysis with an industrial base shows how wide the gap is between strong and weak sales organizations: according to McKinsey, the top quartile achieves roughly 2.6 times the sales return of the bottom quartile, measured as gross margin per euro of sales cost (July 2023, just under 500 B2B companies, including industrial equipment, chemicals and metals).
How many reps hit quota?
There's no single figure, because every study measures something different. Platform data counts reps in their own customers' CRMs, surveys ask managers, and SDR studies measure meeting quotas rather than revenue quotas.
| Source | What is measured | Figure | Base |
|---|---|---|---|
| Ebsta × Pavilion, 2025 GTM Benchmarks | Share of reps missing quota (platform data) | 78% (prior year 69%) | 655,000 opportunities, 2024 data |
| Ebsta × Pavilion, 2024 B2B Sales Benchmarks | Share exceeding quota (platform data) | 31% (2023), with quotas cut by 19% | 4.2 million opportunities, 530 companies |
| Gong, The State of Revenue 2025 | Share hitting quota (as reported by managers) | 48%, up five points year on year | 617 revenue leaders, online survey |
| The Bridge Group, 10th edition | SDRs hitting meeting quota | 60%, the lowest since the series began in 2007 | 351 B2B companies, 83% SaaS |
| RepVue Cloud Sales Index Q2 2026 | Quota attainment, self-reported by reps | 43.60% (Q1 2026: 44.09%) | 252 companies, around 58,500 ratings, cloud/SaaS |
Don't merge these five figures into a single statement like "x% of reps miss quota." Whenever you quote a quota figure, name the source and what it measures.
What are typical win rates, deal sizes and sales cycles?
According to HubSpot, the average win rate was 21% in 2023; according to Ebsta, it was 19% for B2B new business in 2024. The HubSpot figure is self-reported by sales professionals and includes B2C; the Ebsta figure comes from CRM pipeline data, mostly from the tech sector.
Other metrics on closing, deal size and cycle length:
- Close rate: 29% on average according to HubSpot (self-reported, 2023)
- Change in 2024: In Ebsta's data, the new-business win rate fell by a tenth (relative change), deal values rose 54% and cycles got 9% shorter
- Deal size: According to Gong platform data, average deal size rose from $90,900 (2023) to $96,800 (2024), based on 1.3 million opportunities at 811 companies
- Sales cycle: 68.7 days on average (2023: 69.3 days), also Gong data
- Large deals: According to Gong, the win rate rose 3% overall in 2024 and 25% for deals above $250,000
- HubSpot median deal: $4,000, with 47% of all deals between $1,000 and $5,000 (incl. B2C)
Ebsta's 2023 data includes three figures that are often missing from pipeline reviews. Reps attributed 61% of lost deals to indecision. When a deal slipped, the win rate dropped by 67%, and 44% of all deals slipped. In the 2024 data, 14% of reps generate 80% of revenue.
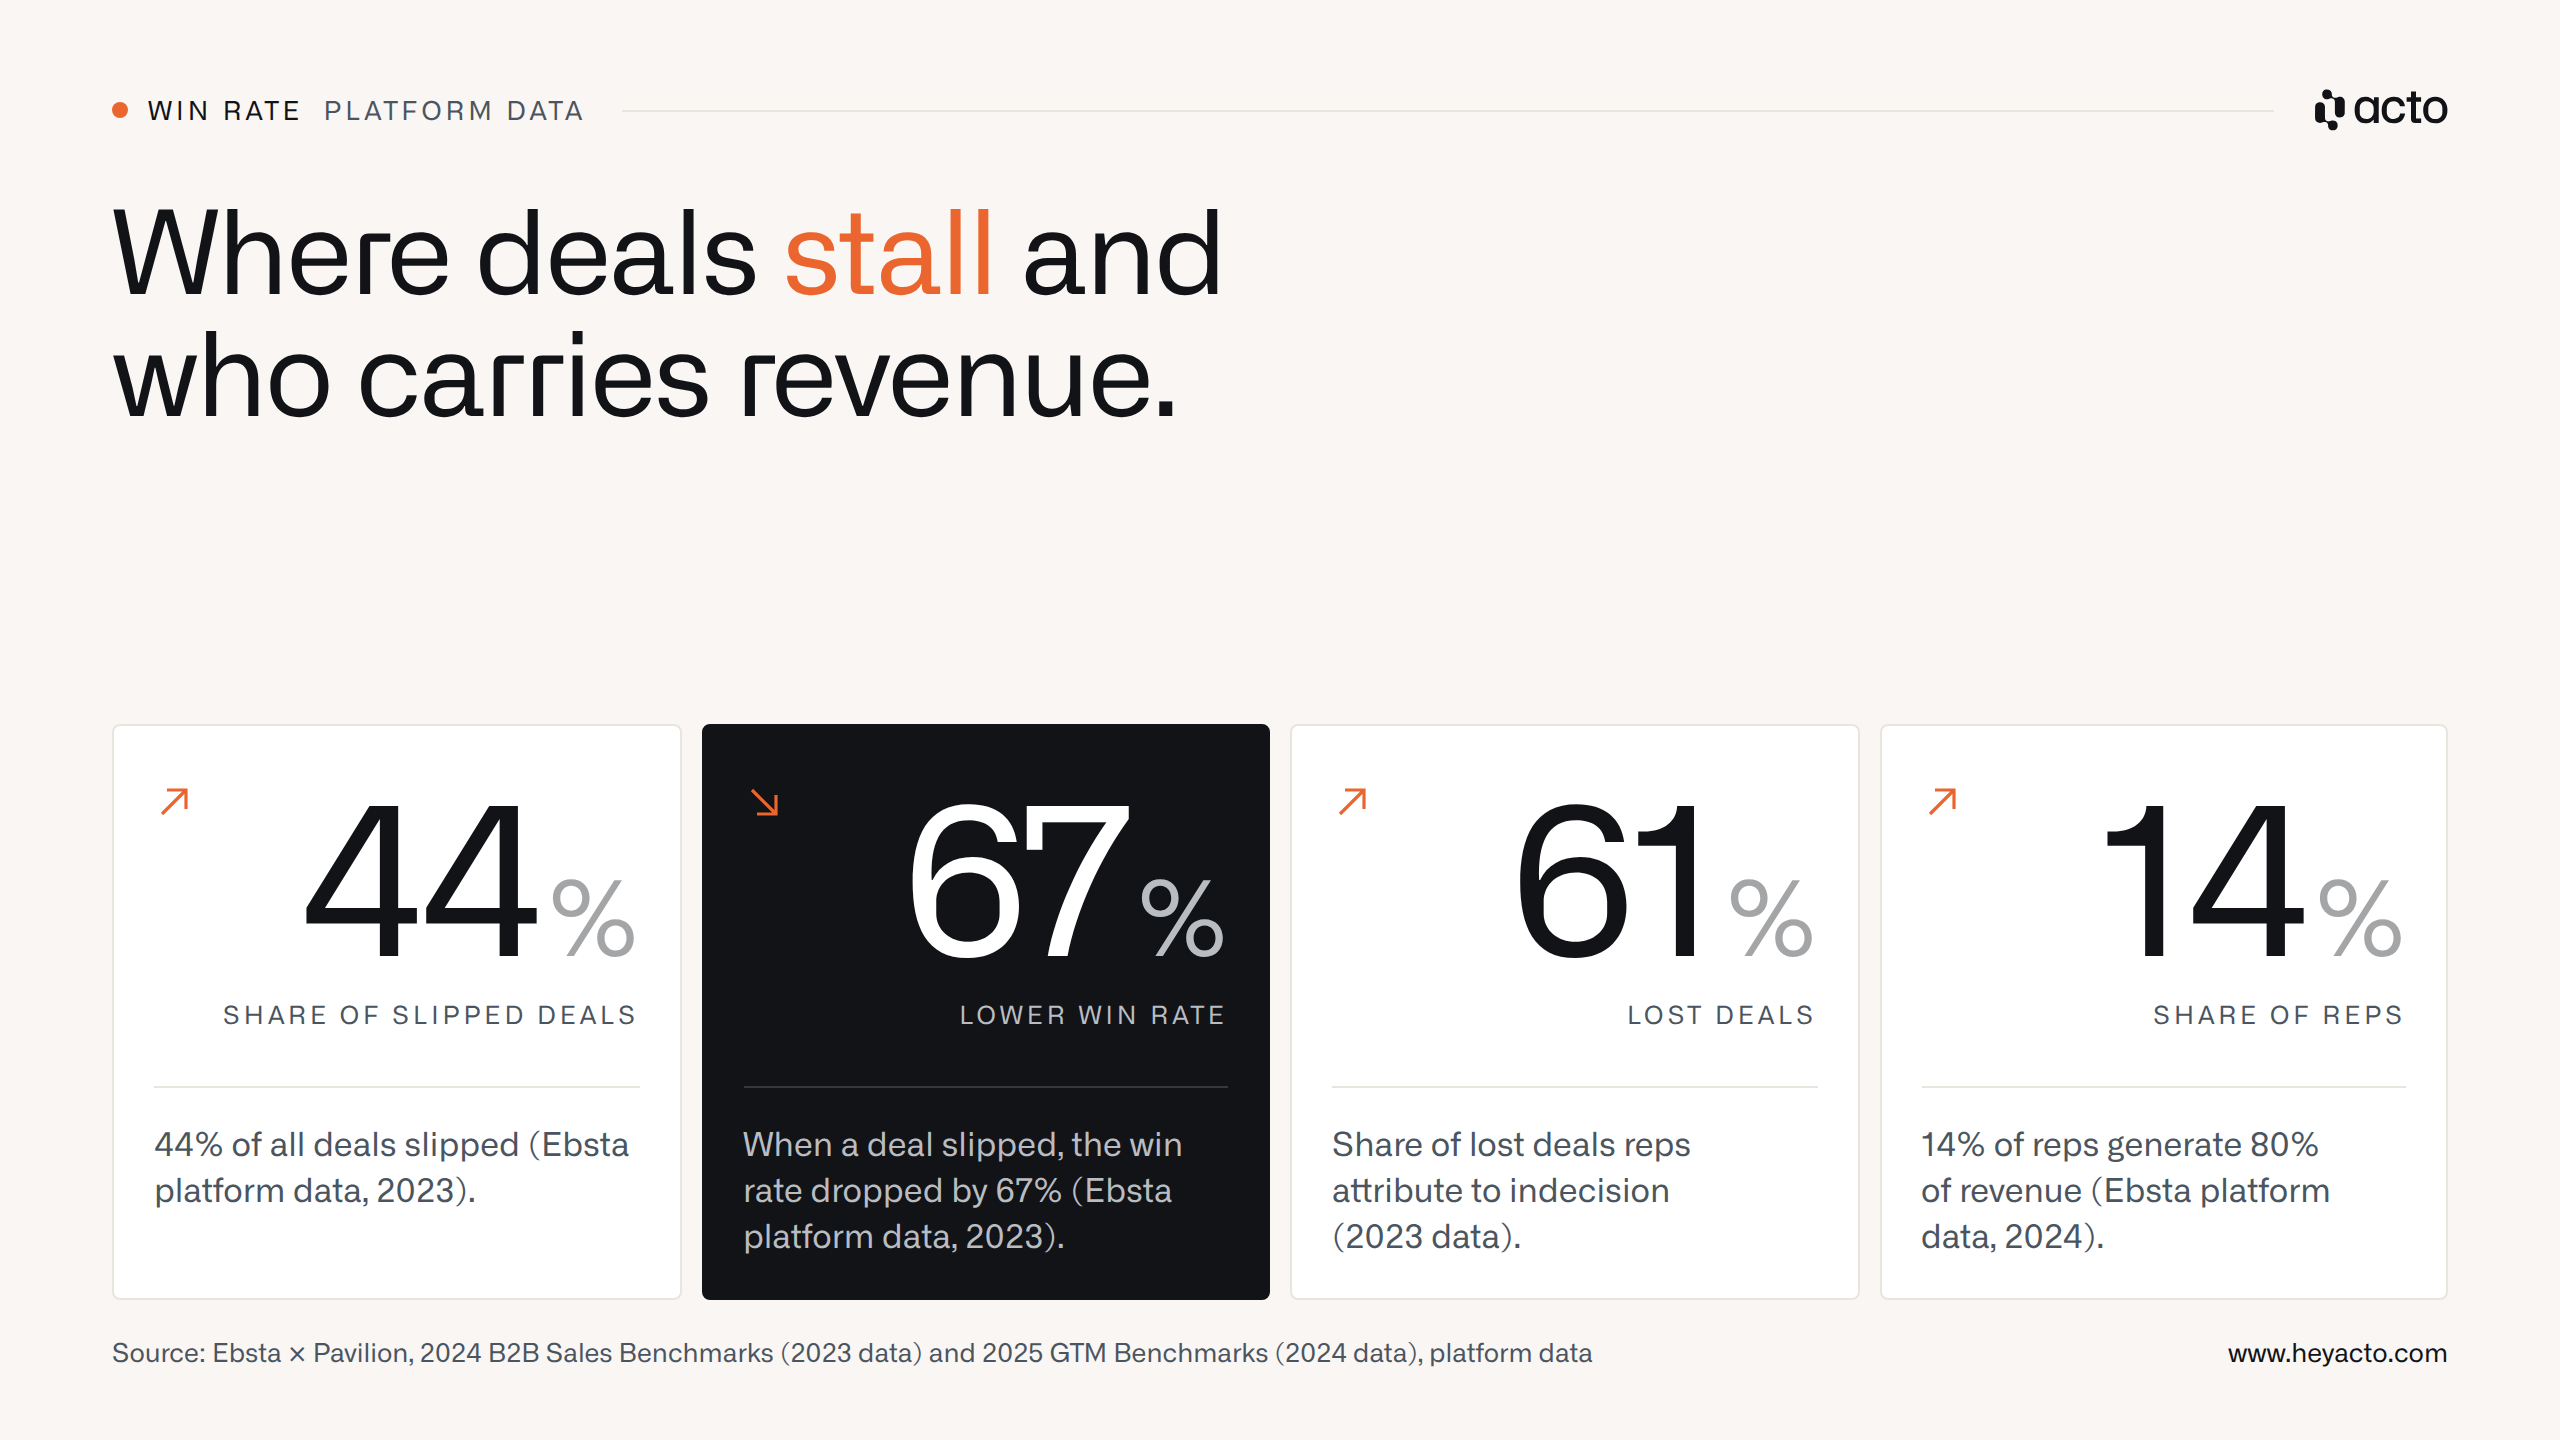
Slipped deals and indecisive buyers cost the most deals, and revenue depends on a small group of reps.
How do B2B customers buy today?
67% of B2B buyers prefer buying without a sales rep, yet 69% would still rather check AI answers with one. Both figures come from Gartner (surveys of 646 and 645 buyers respectively, August to September 2025). The year before, 61% preferred buying without a rep (632 buyers, 2024).
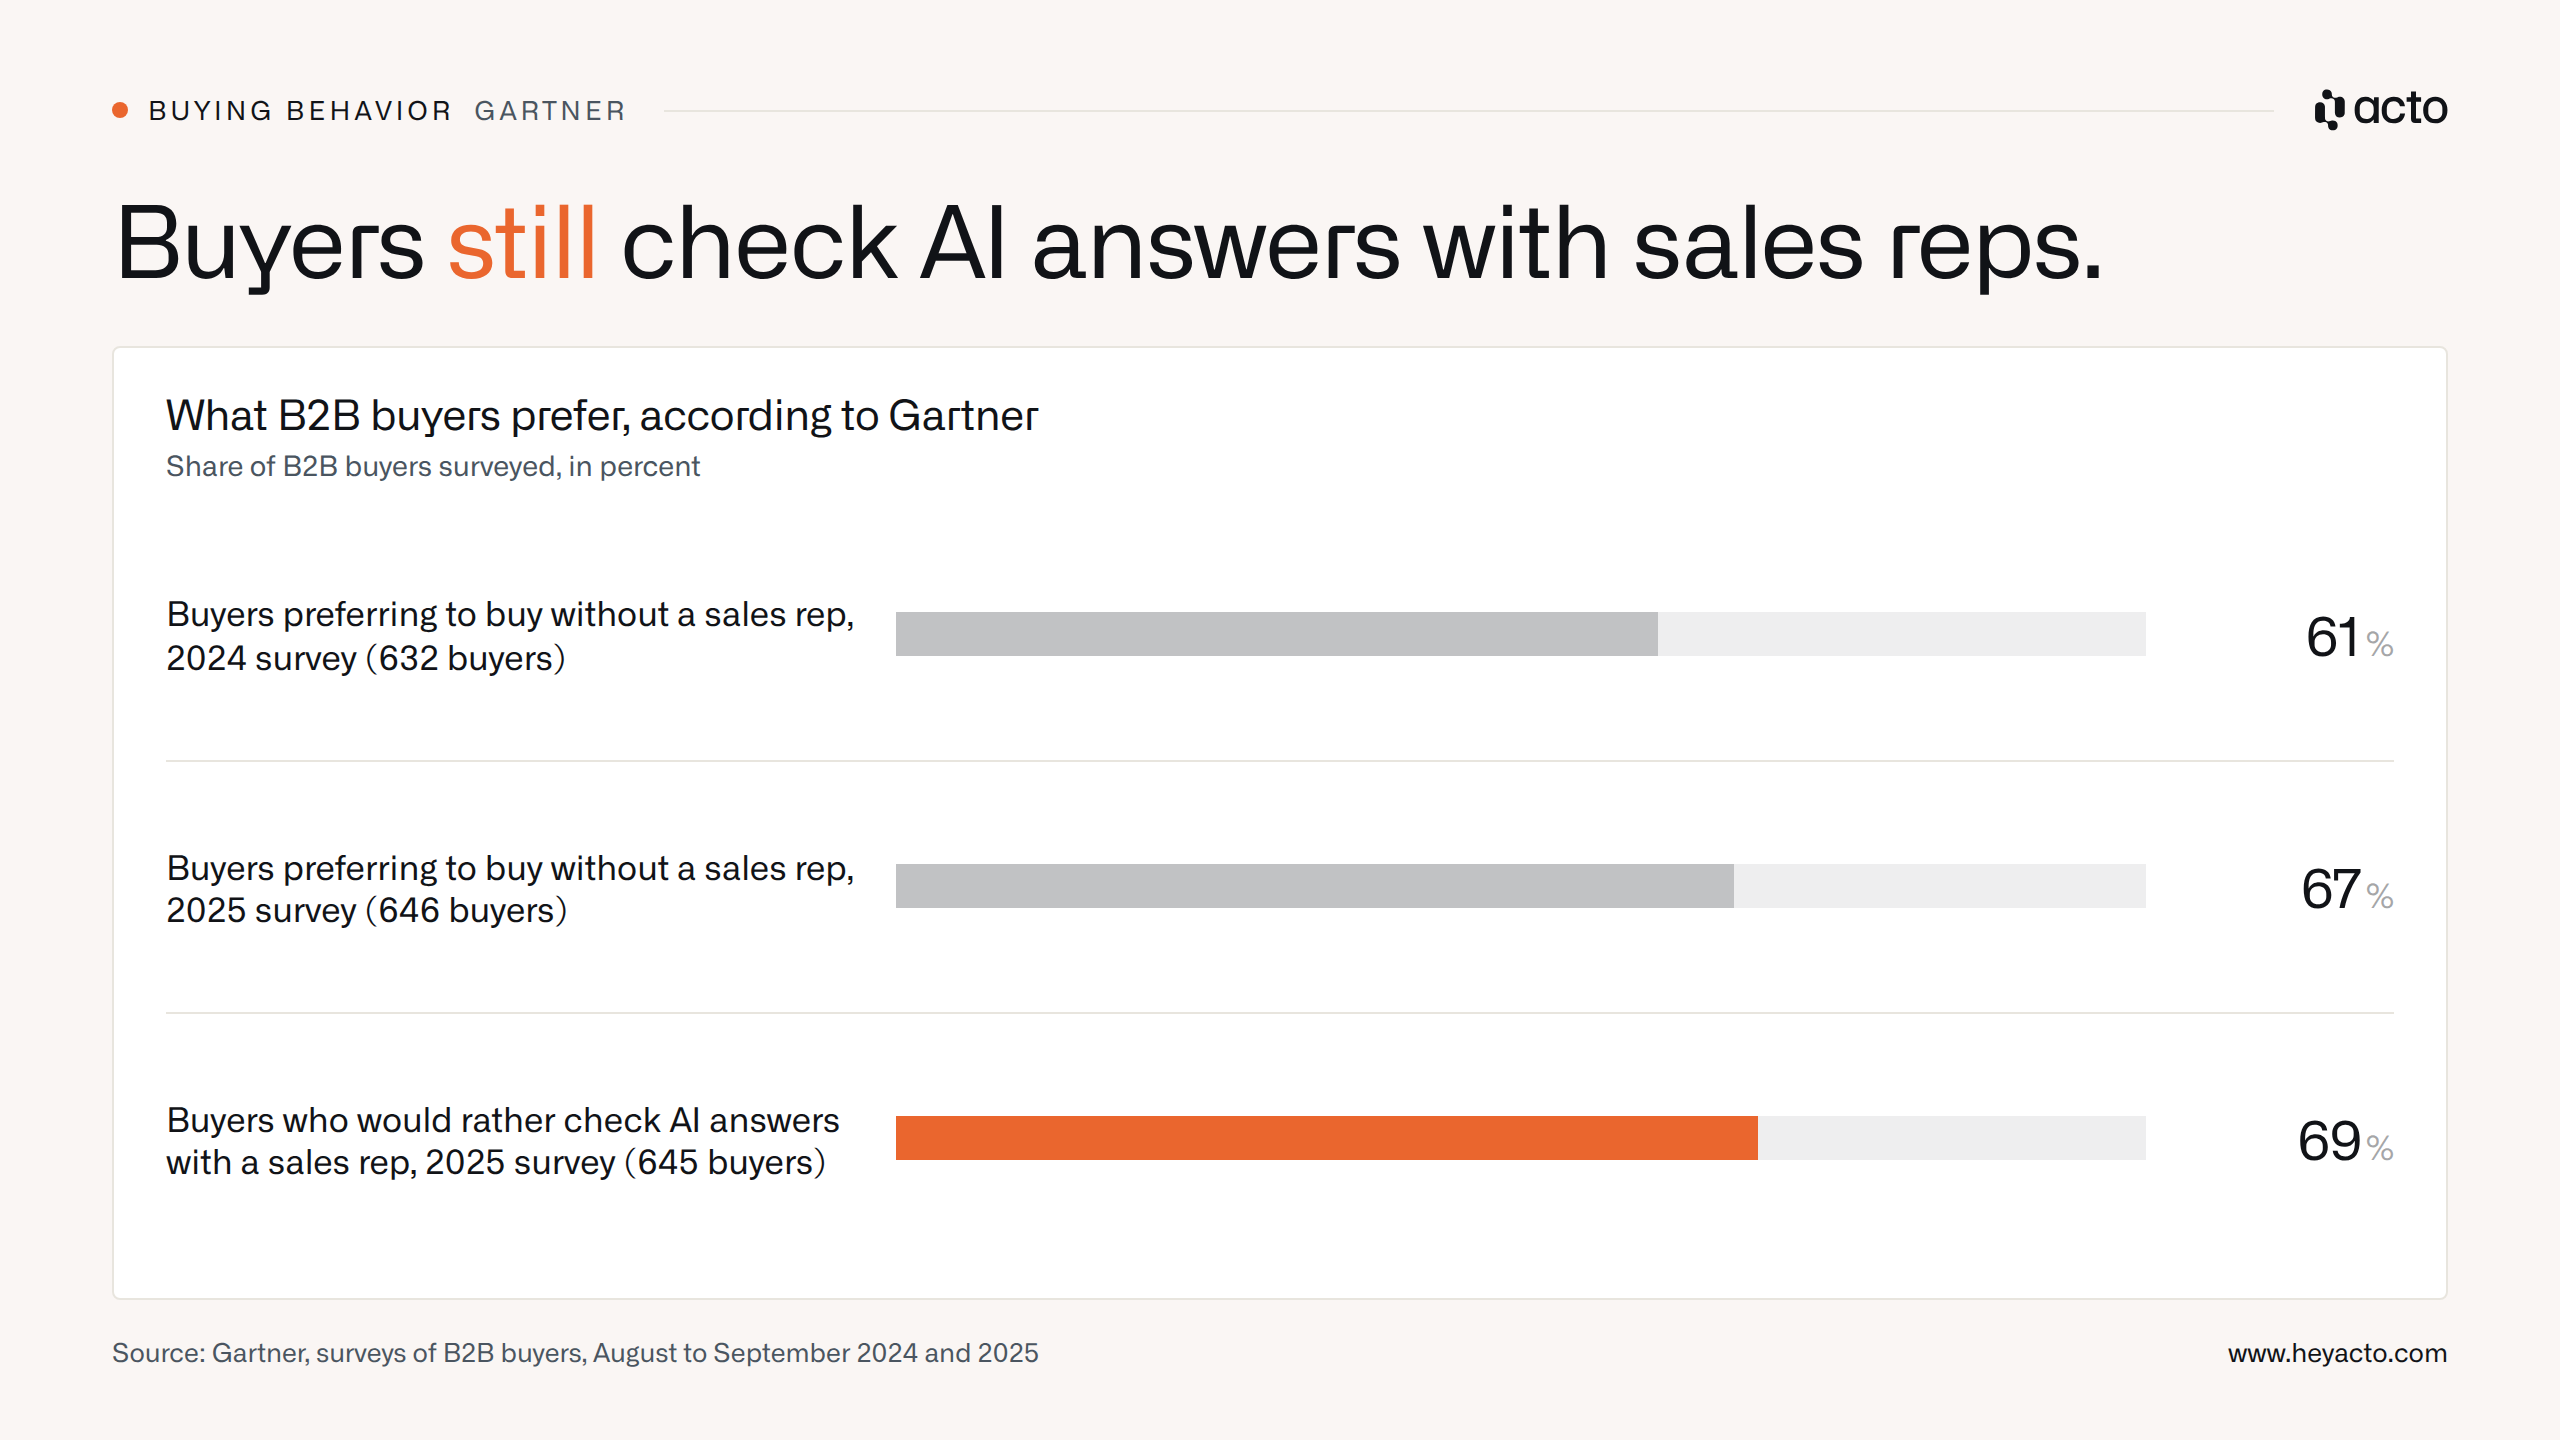
Buyers want less contact with sales reps, yet seek it out as soon as they don't trust an AI answer.
More figures on buying behavior, each with its base:
- Departments: 89% of purchases involve two or more departments (Forrester, 2024)
- Dissatisfaction: 81% of buyers are dissatisfied with the vendor they chose (Forrester, 2024)
- Generative AI: Nearly 95% expect to use it in the buying process within twelve months (Forrester, 2024); 45% already used it in a recent purchase; the buyers surveyed used seven information sources on average (Gartner, 2025)
- Irrelevant outreach: 73% avoid suppliers that send irrelevant messages (Gartner, 2024)
- Rule of thirds: Buyers split roughly into thirds, preferring in-person, remote or digital self-service interaction (McKinsey B2B Pulse 2024)
- From the sellers' perspective: 57% say customers decide more slowly, 69% say measurable ROI matters more than a year ago, and 67% say customers need a lot of explanation before buying (Salesforce, 2025)
In HubSpot's survey, sales professionals say 96% of prospects do their own research before talking to a rep, and 71% prefer it that way. Both figures, however, only reflect how reps perceive their customers. According to the same survey, 52% see B2B customers using more self-service tools than a year ago.
A sales leader described on our podcast what this expectation feels like day to day at a manufacturer.
"Nowadays, when we get an inquiry from a customer, it's simply a fact that no customer wants to wait a week for a quote anymore."
– Sascha Niederhagen, EVP, WIKA (Revenue Signals, episode with Sascha Niederhagen)
Potenzialbasierter Vertrieb, KI & warum Veränderung Halt braucht
How big is a B2B buying group?
Forrester counts 13 people on average in a B2B purchase decision; at TrustRadius, 96% of buying groups for software purchases have five members or fewer. Forrester counts everyone involved in a purchase decision and arrives at 13. TrustRadius measures the core group in software purchases: there, 96% of buying groups have five members or fewer, and 53% include someone from senior management (2,164 technology buyers, 2024).
The same TrustRadius study includes figures that apply only to software purchases and don't carry over to manufacturing or wholesale. Shortlists contain two to three products, and 71% of buyers buy their first choice. 86% of enterprise buyers shortlisted a product they already knew before starting their research. 87% completed the purchase within six months, compared with 65% in the enterprise segment.
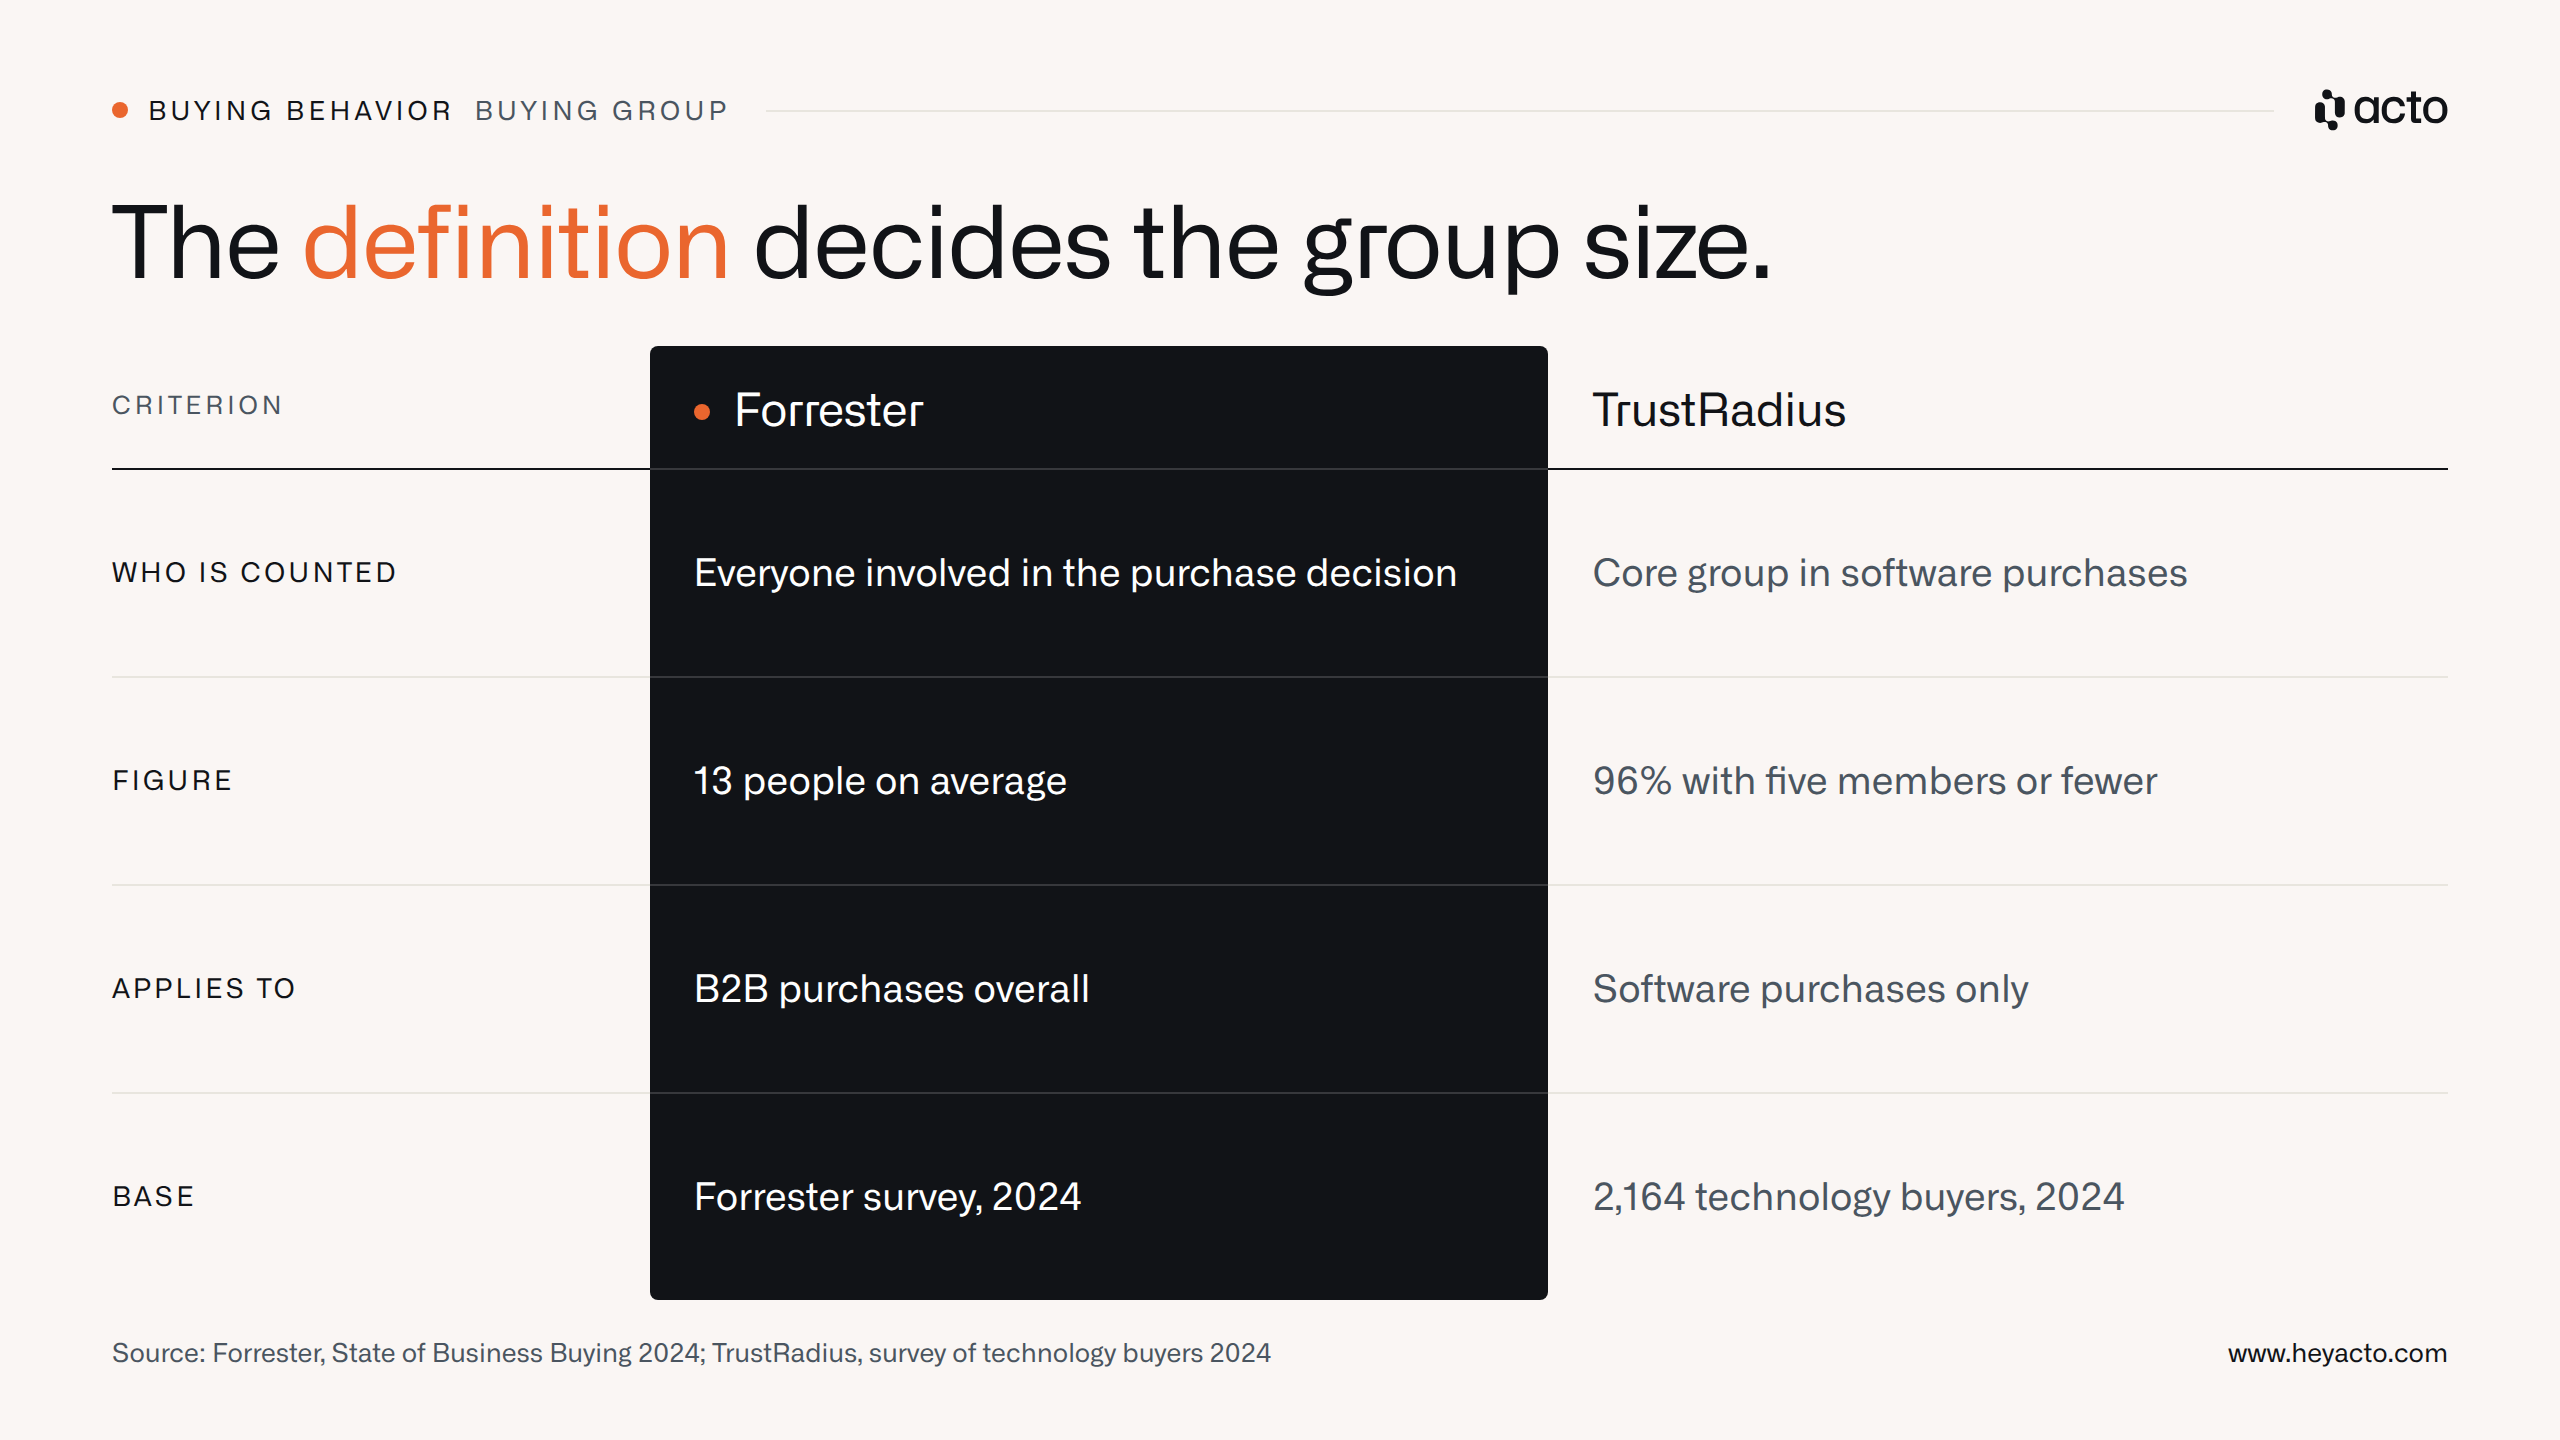
Five people or 13 depends on the definition: the core group in a software purchase, or everyone involved.
What do cold outreach and follow-up deliver?
According to Gong platform data from more than 300 million cold calls, the average rep reaches someone on 5.4% of calls; the top quartile on 13.3%. That's 19 dials per conversation versus 8. In Gong's 2024 analysis, a booked meeting counts as a success.
The remaining prospecting figures come from platform data, surveys and an SDR study:
- Meetings from conversations: Top reps book a meeting in 16.7% of conversations, the average in 4.6% (Gong)
- Call plus email: In Gong's platform data, the email reply rate with a call, even without reaching anyone, was 3.44%, versus 1.81% without a call (Gong)
- Cold email: According to Instantly platform data, the average reply rate is 3.43%, 5.5% in the top quartile and at least 10.7% in the top 10%; 58% of replies come to the first email, 42% to follow-ups
- SDR conversations: SDRs hold 4.1 qualified conversations a day; phone-heavy teams need 56 calls for 4.6 conversations, email-heavy teams 28 for 3.4 (Bridge Group)
- SDR targets: The median monthly quota is ten held first meetings, 40% fewer than in 2018; each SDR generates a median of $3.78 million in pipeline per year (2022: $2.83 million)
- Cold calling as a channel: 24% of sales organizations use cold calling as their main channel, 12% have dropped it and 21% have never used it (HubSpot, State of Cold Calling 2025, 379 respondents)
- Capacity: 48% of sales professionals lack the time for enough cold outreach (Salesforce, 2025)
According to Bridge Group, the median SDR logs 112 activities a day. The breakdown by channel shows how dominant phone and email still are.
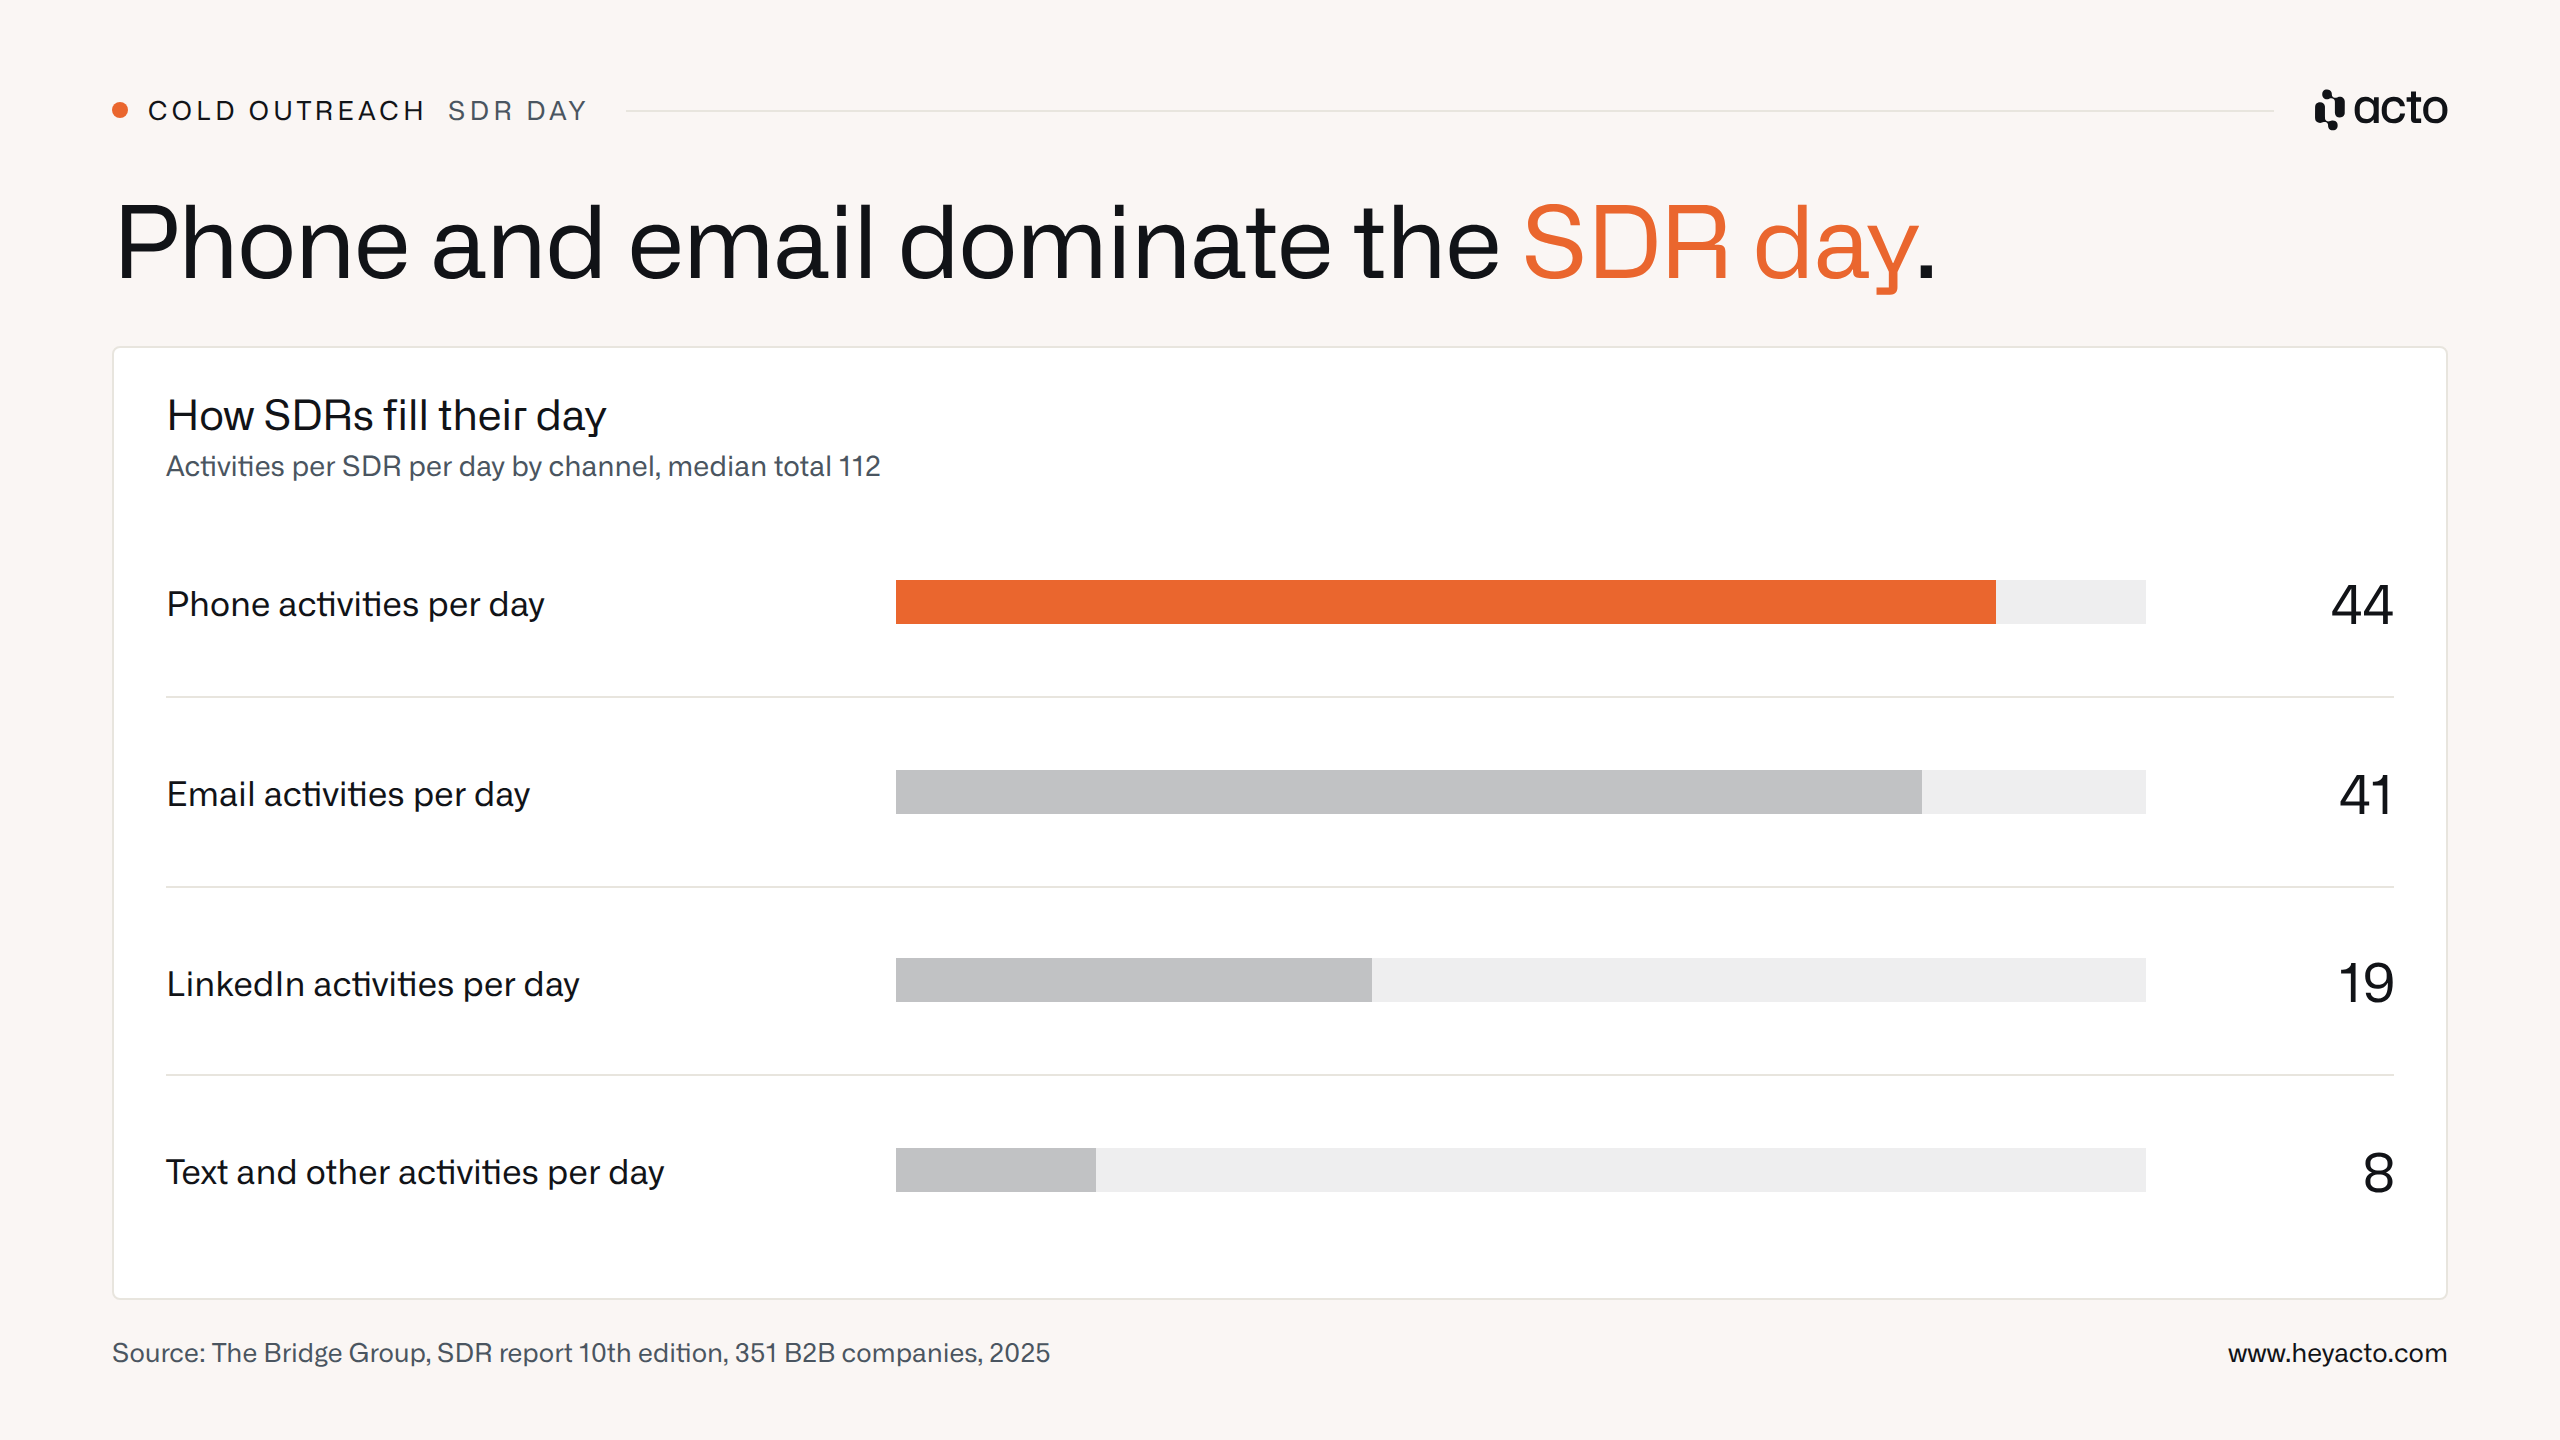
Phone and email account for three quarters of SDRs' daily activities.
The often-quoted rule that most deals only close after the fifth to twelfth contact is covered below, in the section on figures you should stop quoting.
How much revenue comes from existing customers?
According to Ebsta platform data, 52% of new revenue in 2024 came from existing customers. Expansion deals were won 45% of the time versus 19% for new business, and they closed after 52 days instead of 91.
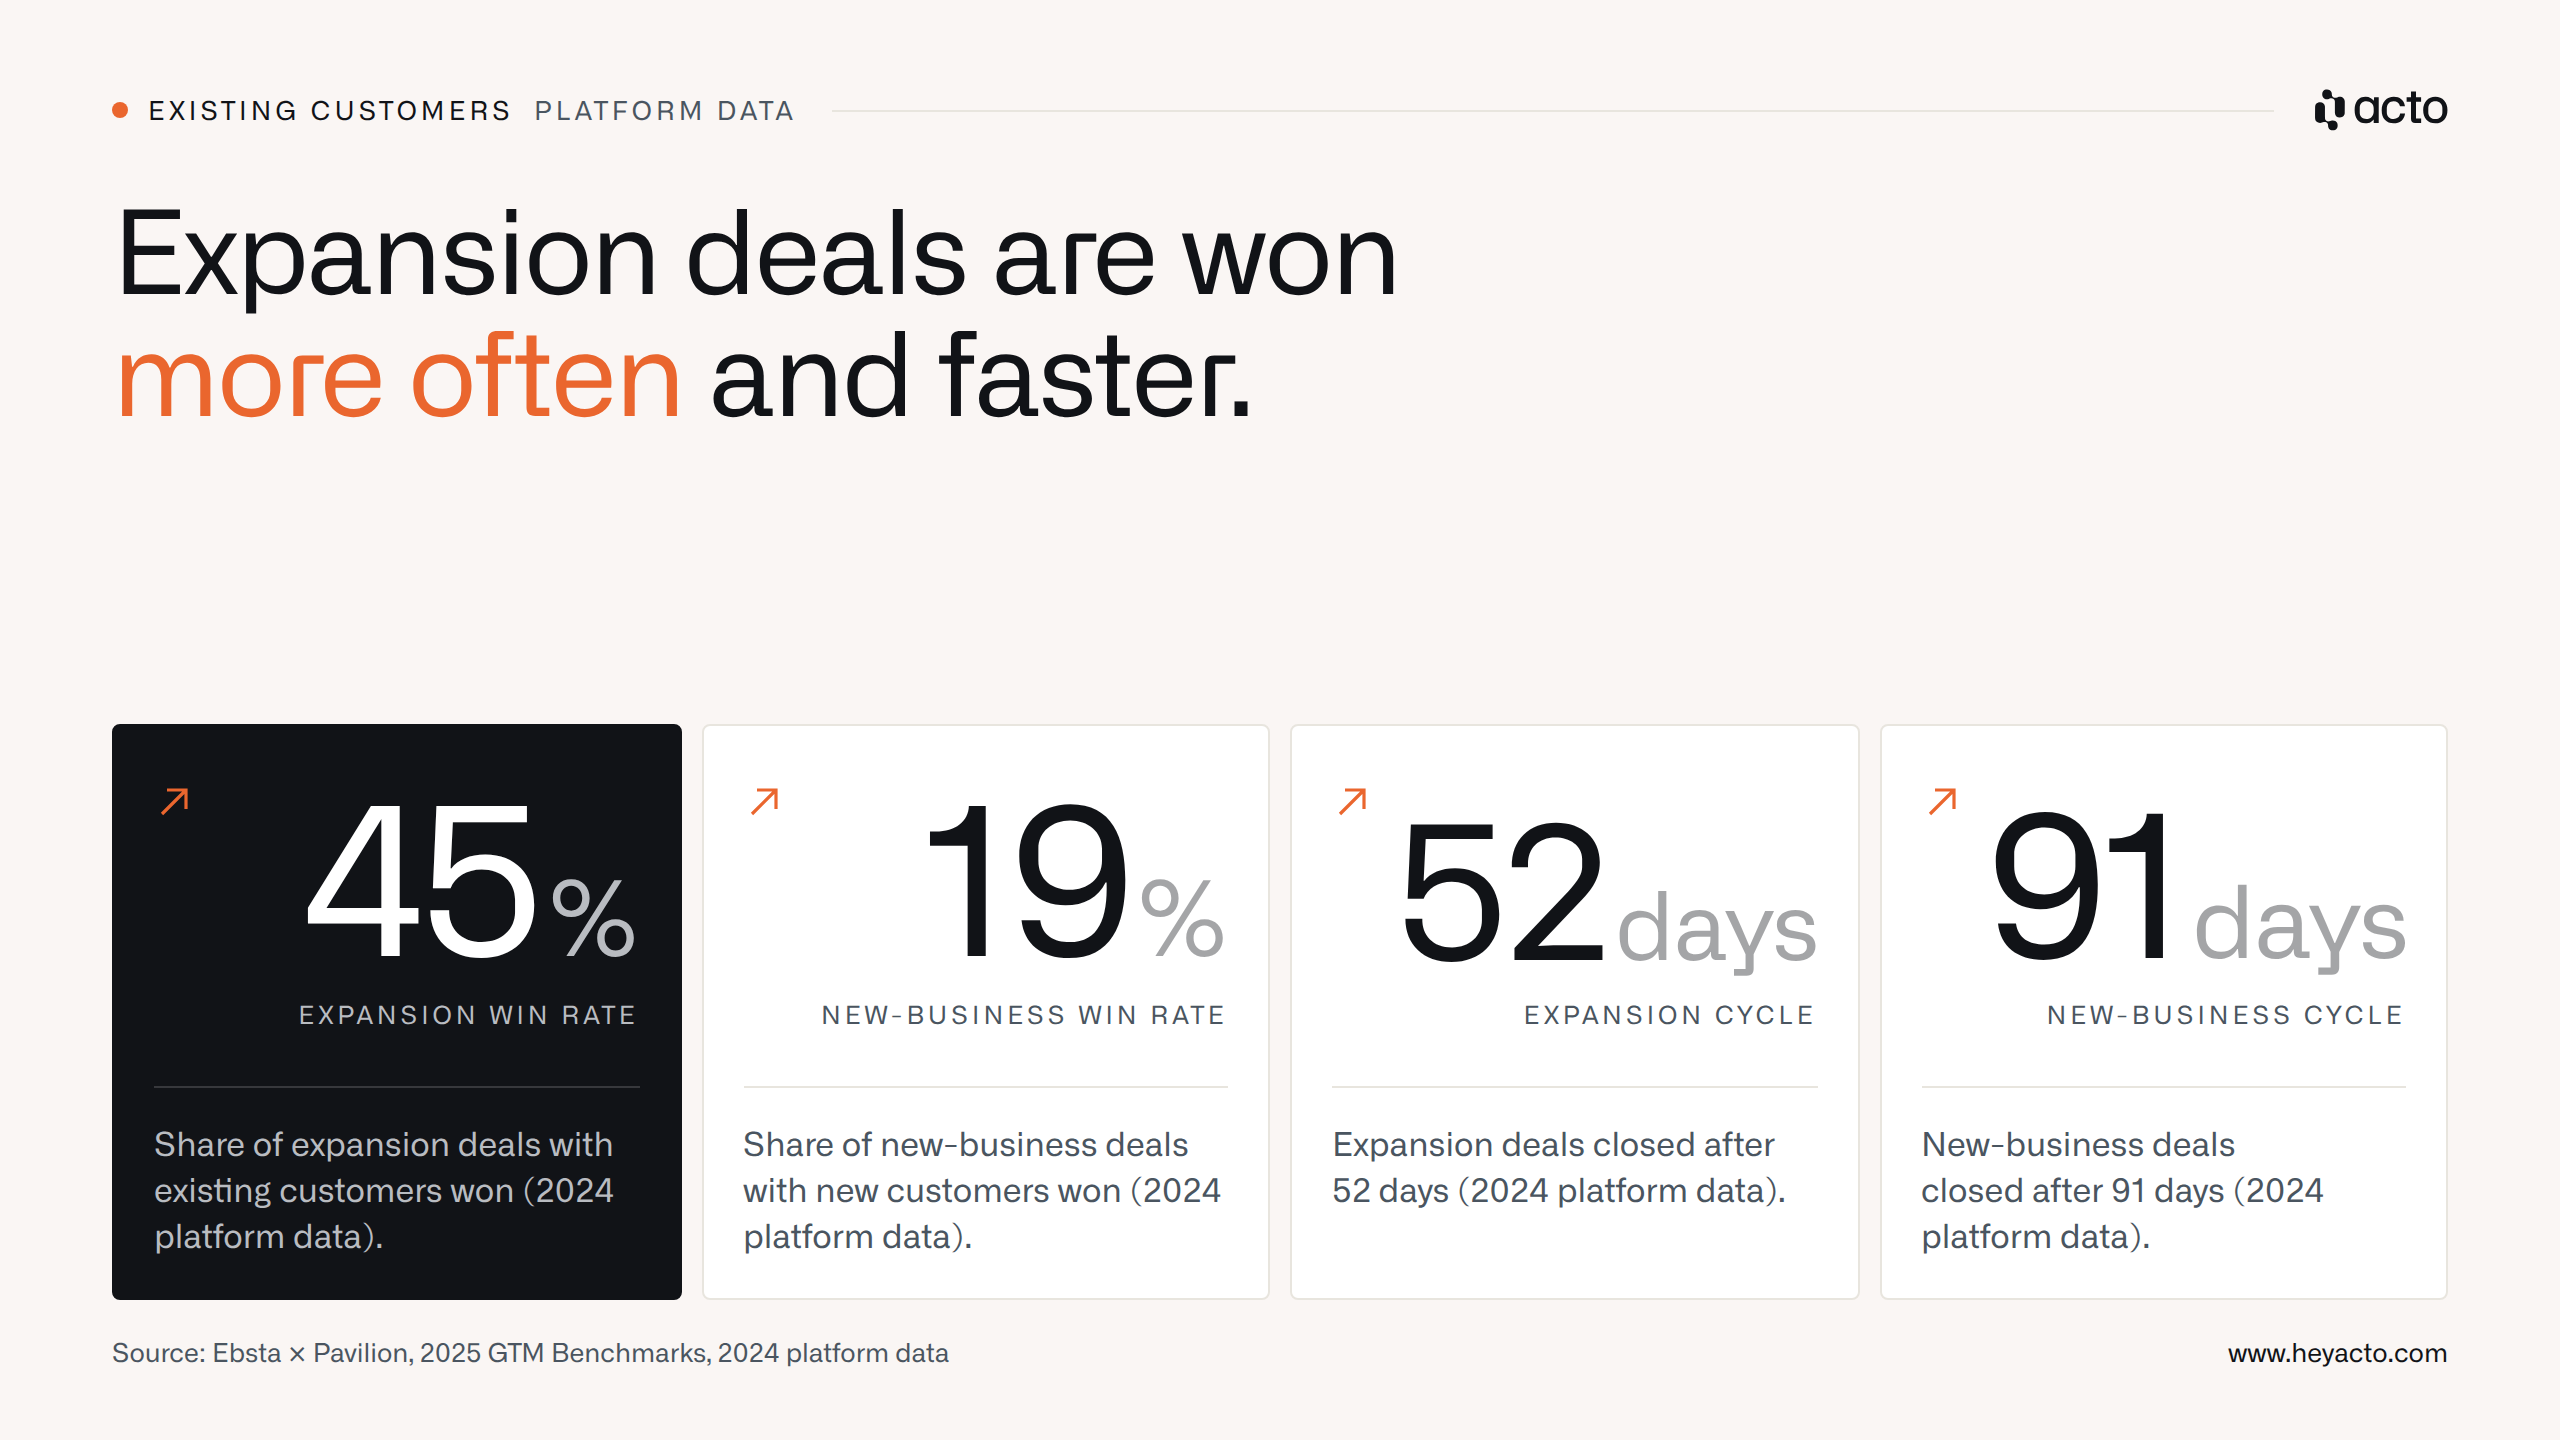
Expansion business is won more than twice as often and closes much faster.
More figures on existing-customer business:
- Revenue share: Sales professionals estimate that 72% of company revenue comes from existing customers and 28% from new ones (HubSpot, self-reported, B2B and B2C)
- Upselling and cross-selling: 91% of respondents upsell and 87% cross-sell; by their own account, each brings in 21% of revenue (HubSpot)
- Growth initiative: For 65% of revenue leaders, upselling and cross-selling to existing customers was the top initiative for 2025 (Gong, 617 respondents)
- Renewals: 73% of organizations missed their renewal targets in 2023 (Gong)
- Reasons for churn: Business buyers who stopped buying from a supplier cite high prices (53%) and poor service (41%) (Salesforce, State of the AI-Connected Customer, 1,570 business buyers, 2024)
We cover how new and existing business stack up against each other in B2B in detail in our article New customers or existing customers. The common claim that a new customer costs five to 25 times as much as an existing one is among the myths further down.
How do sales teams use AI?
87% of sales organizations use some form of AI, according to the 7th edition of Salesforce's State of Sales (4,050 respondents, 2025). For companies across all sectors, the population is different: according to Eurostat, 19.95% of EU companies with ten or more employees used AI in 2025 (2024: 13.48%), rising to 55.03% among large companies with 250 or more employees.
We split the remaining AI figures into measurements and expectations:
- Sales as a use case (measured): Among EU companies using AI, 34.7% use it in marketing or sales, the most common use case (Eurostat, 2025)
- Agents (survey): 54% of reps have used AI agents, and nearly nine in ten plan to by 2027 (Salesforce)
- Time savings (expectation): Reps expect agents to cut prospect research time by 34% and email writing time by 36% (Salesforce, respondents' estimate)
- Obstacles (survey): 51% of sales leaders using AI say disconnected systems are slowing their AI projects; 46% of agent users say poor data quality hurts their selling (Salesforce)
- Revenue teams (vendor survey): 48% use AI, another 24% plan to within twelve months, 27% don't (Gong)
- Automation (vendor survey): At 88%, automating manual work is the top AI use case in sales and marketing teams; 34% of companies already use AI to automate sales tasks (Ebsta × Pavilion)
- Self-reported: Those who use AI for admin tasks report saving two hours a day (HubSpot)
McKinsey estimates that automation and AI can free up around 20% of a sales team's capacity, roughly 30 to 40% of the time spent away from customers. The figure is an estimate based on more than 70 use cases.
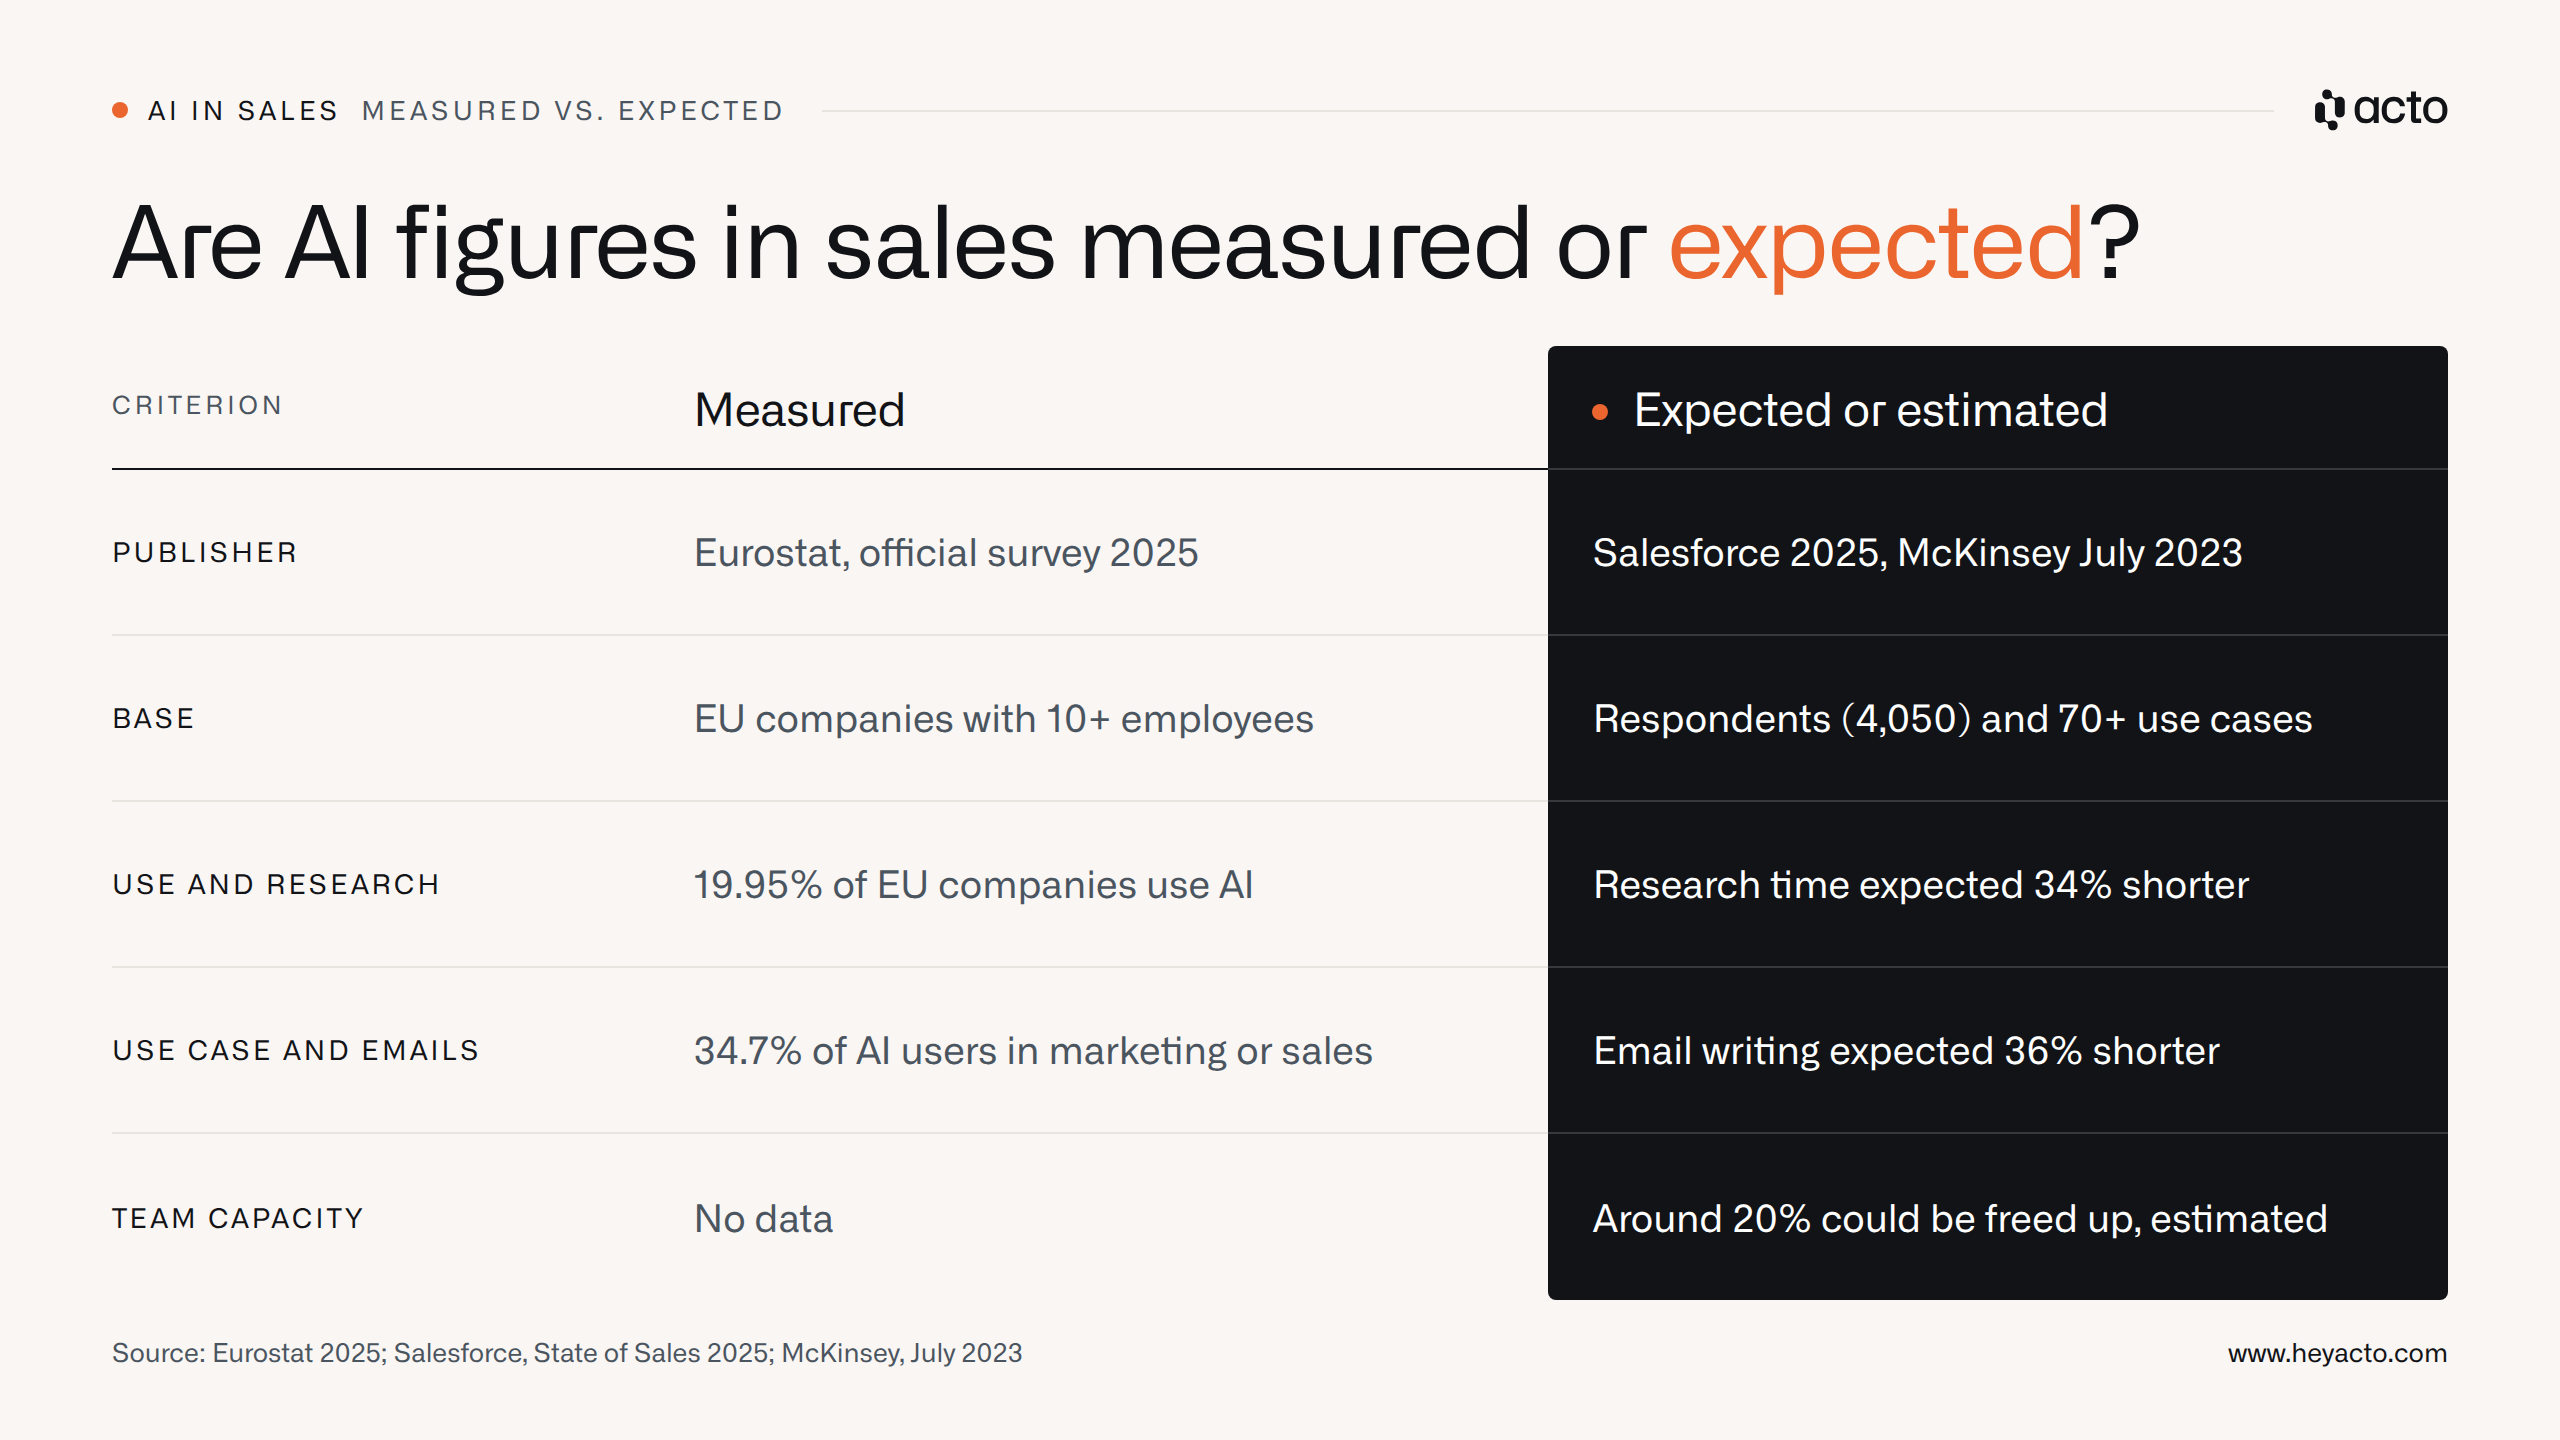
Many AI figures in sales are expectations or estimates and should be quoted as such.
A guest from technical distribution named another obstacle to day-to-day adoption on our podcast.
"Actually, I'd see precisely the human factor […] as the big challenge […] at the moment."
– André Buck, Berner (Revenue Signals, episode with André Buck)
Omnichannel, Pricing & vom Informationsvermittler zum Wertearchitekten

How stable are sales teams?
Median annual SDR attrition was 40% in 2024, according to The Bridge Group (351 B2B companies, 78% North America, 83% SaaS). Involuntary departures contributed 13 percentage points to the attrition rate, voluntary departures 11 and promotions 16; the interquartile range runs from 21% to 57%.
From the same study and other sources:
- Tenure: SDRs stay 1.9 years on average, the highest since the early 2010s
- Ramp time: 3.0 months, the lowest since 2010 (peak of 3.8 months in 2014)
- Span of control: One SDR manager oversees 6.4 reps, down from eight in 2021 to 2023
- Attrition below target: Among reps who missed their numbers, attrition rose from 22% to 36% in 2023 (Ebsta, this group only)
- Reasons for leaving: Lack of career advancement is the top reason for changing jobs among Gen Z, millennials and baby boomers; for Gen X it's pay (Salesforce)
- Skills: 88% of B2B salespeople see customer understanding and analytical thinking as the most important skill, but only 27% feel confident in it (Mercuri International, 591 respondents, 40% from industry and manufacturing, surveyed late 2024)
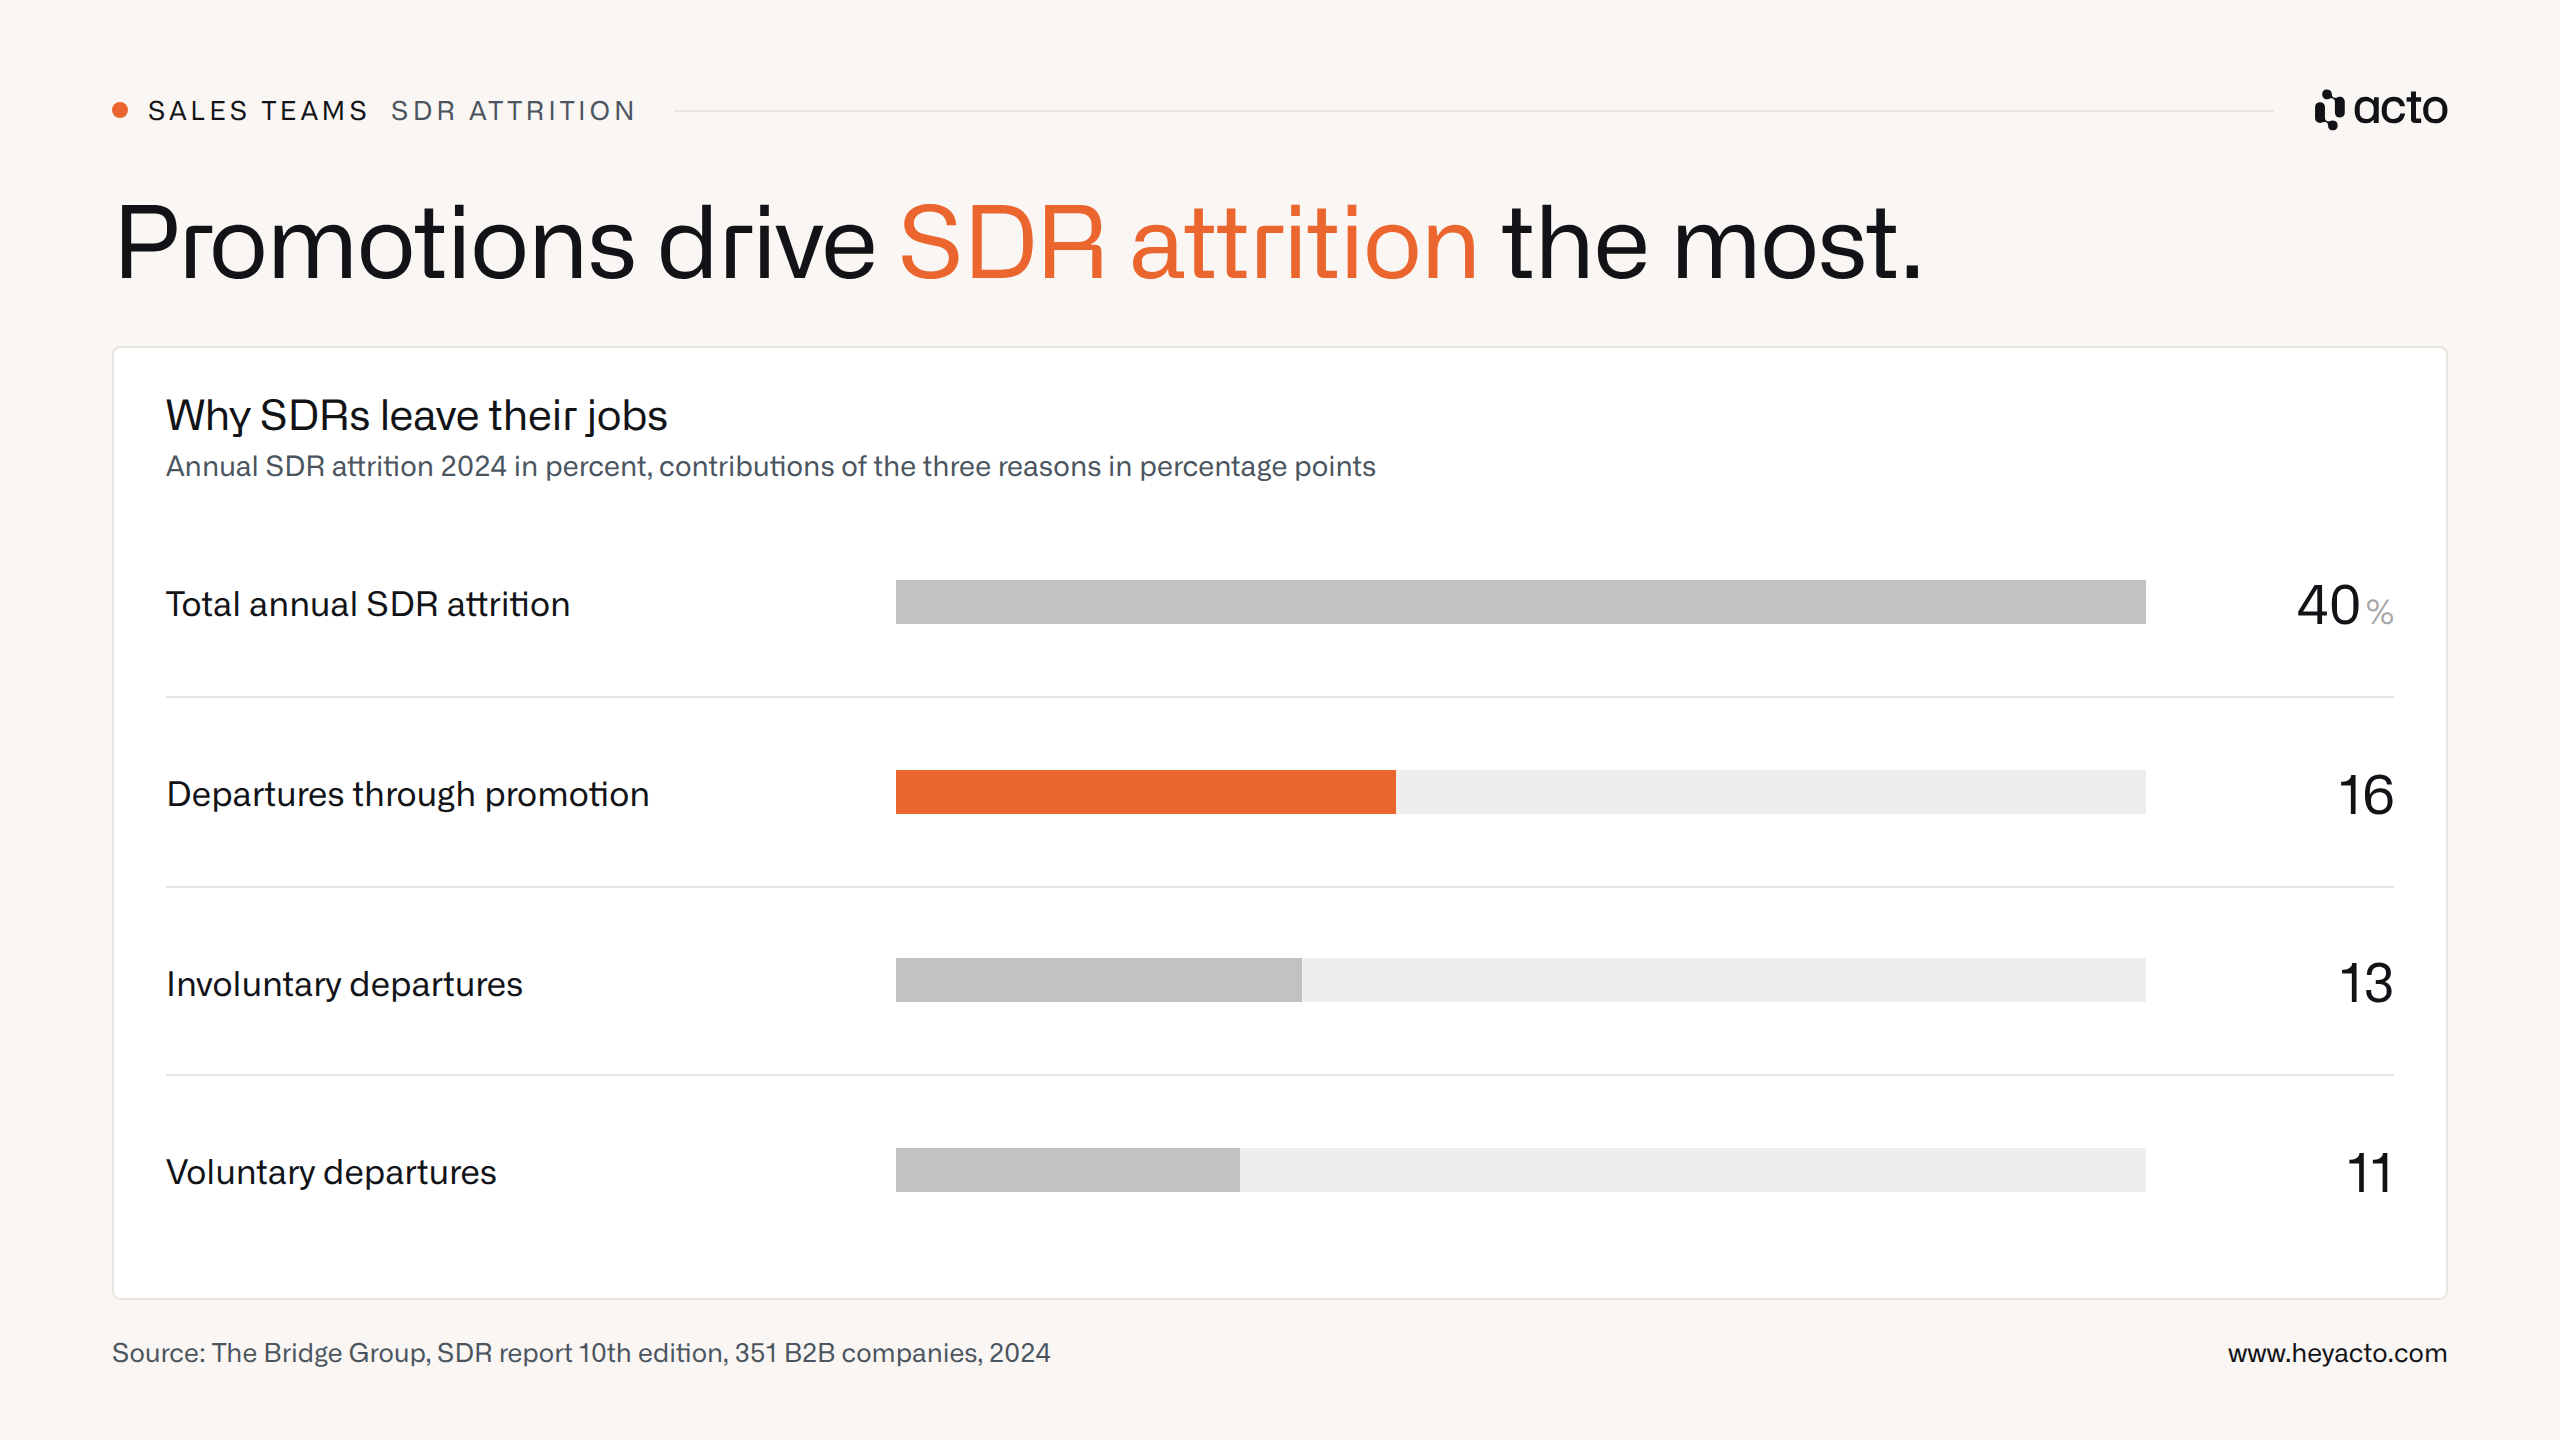
Of the 40% attrition rate, promotions account for 16 percentage points, involuntary departures 13 and voluntary departures 11. Source: The Bridge Group, 10th edition, 2024
Salaries are covered in the FAQ at the end of the page.
What do the figures show for Germany and Austria?
According to official data, 26% of German companies with 10 or more employees used AI in 2025, rising to 57% among large companies with 250 or more (Destatis). More recent surveys put the figure at 57% (Bitkom 2026, 20 or more employees) and 54.5% according to the ifo business survey (May 2026, around 45% in trade). The figures differ in year, company size and question wording.
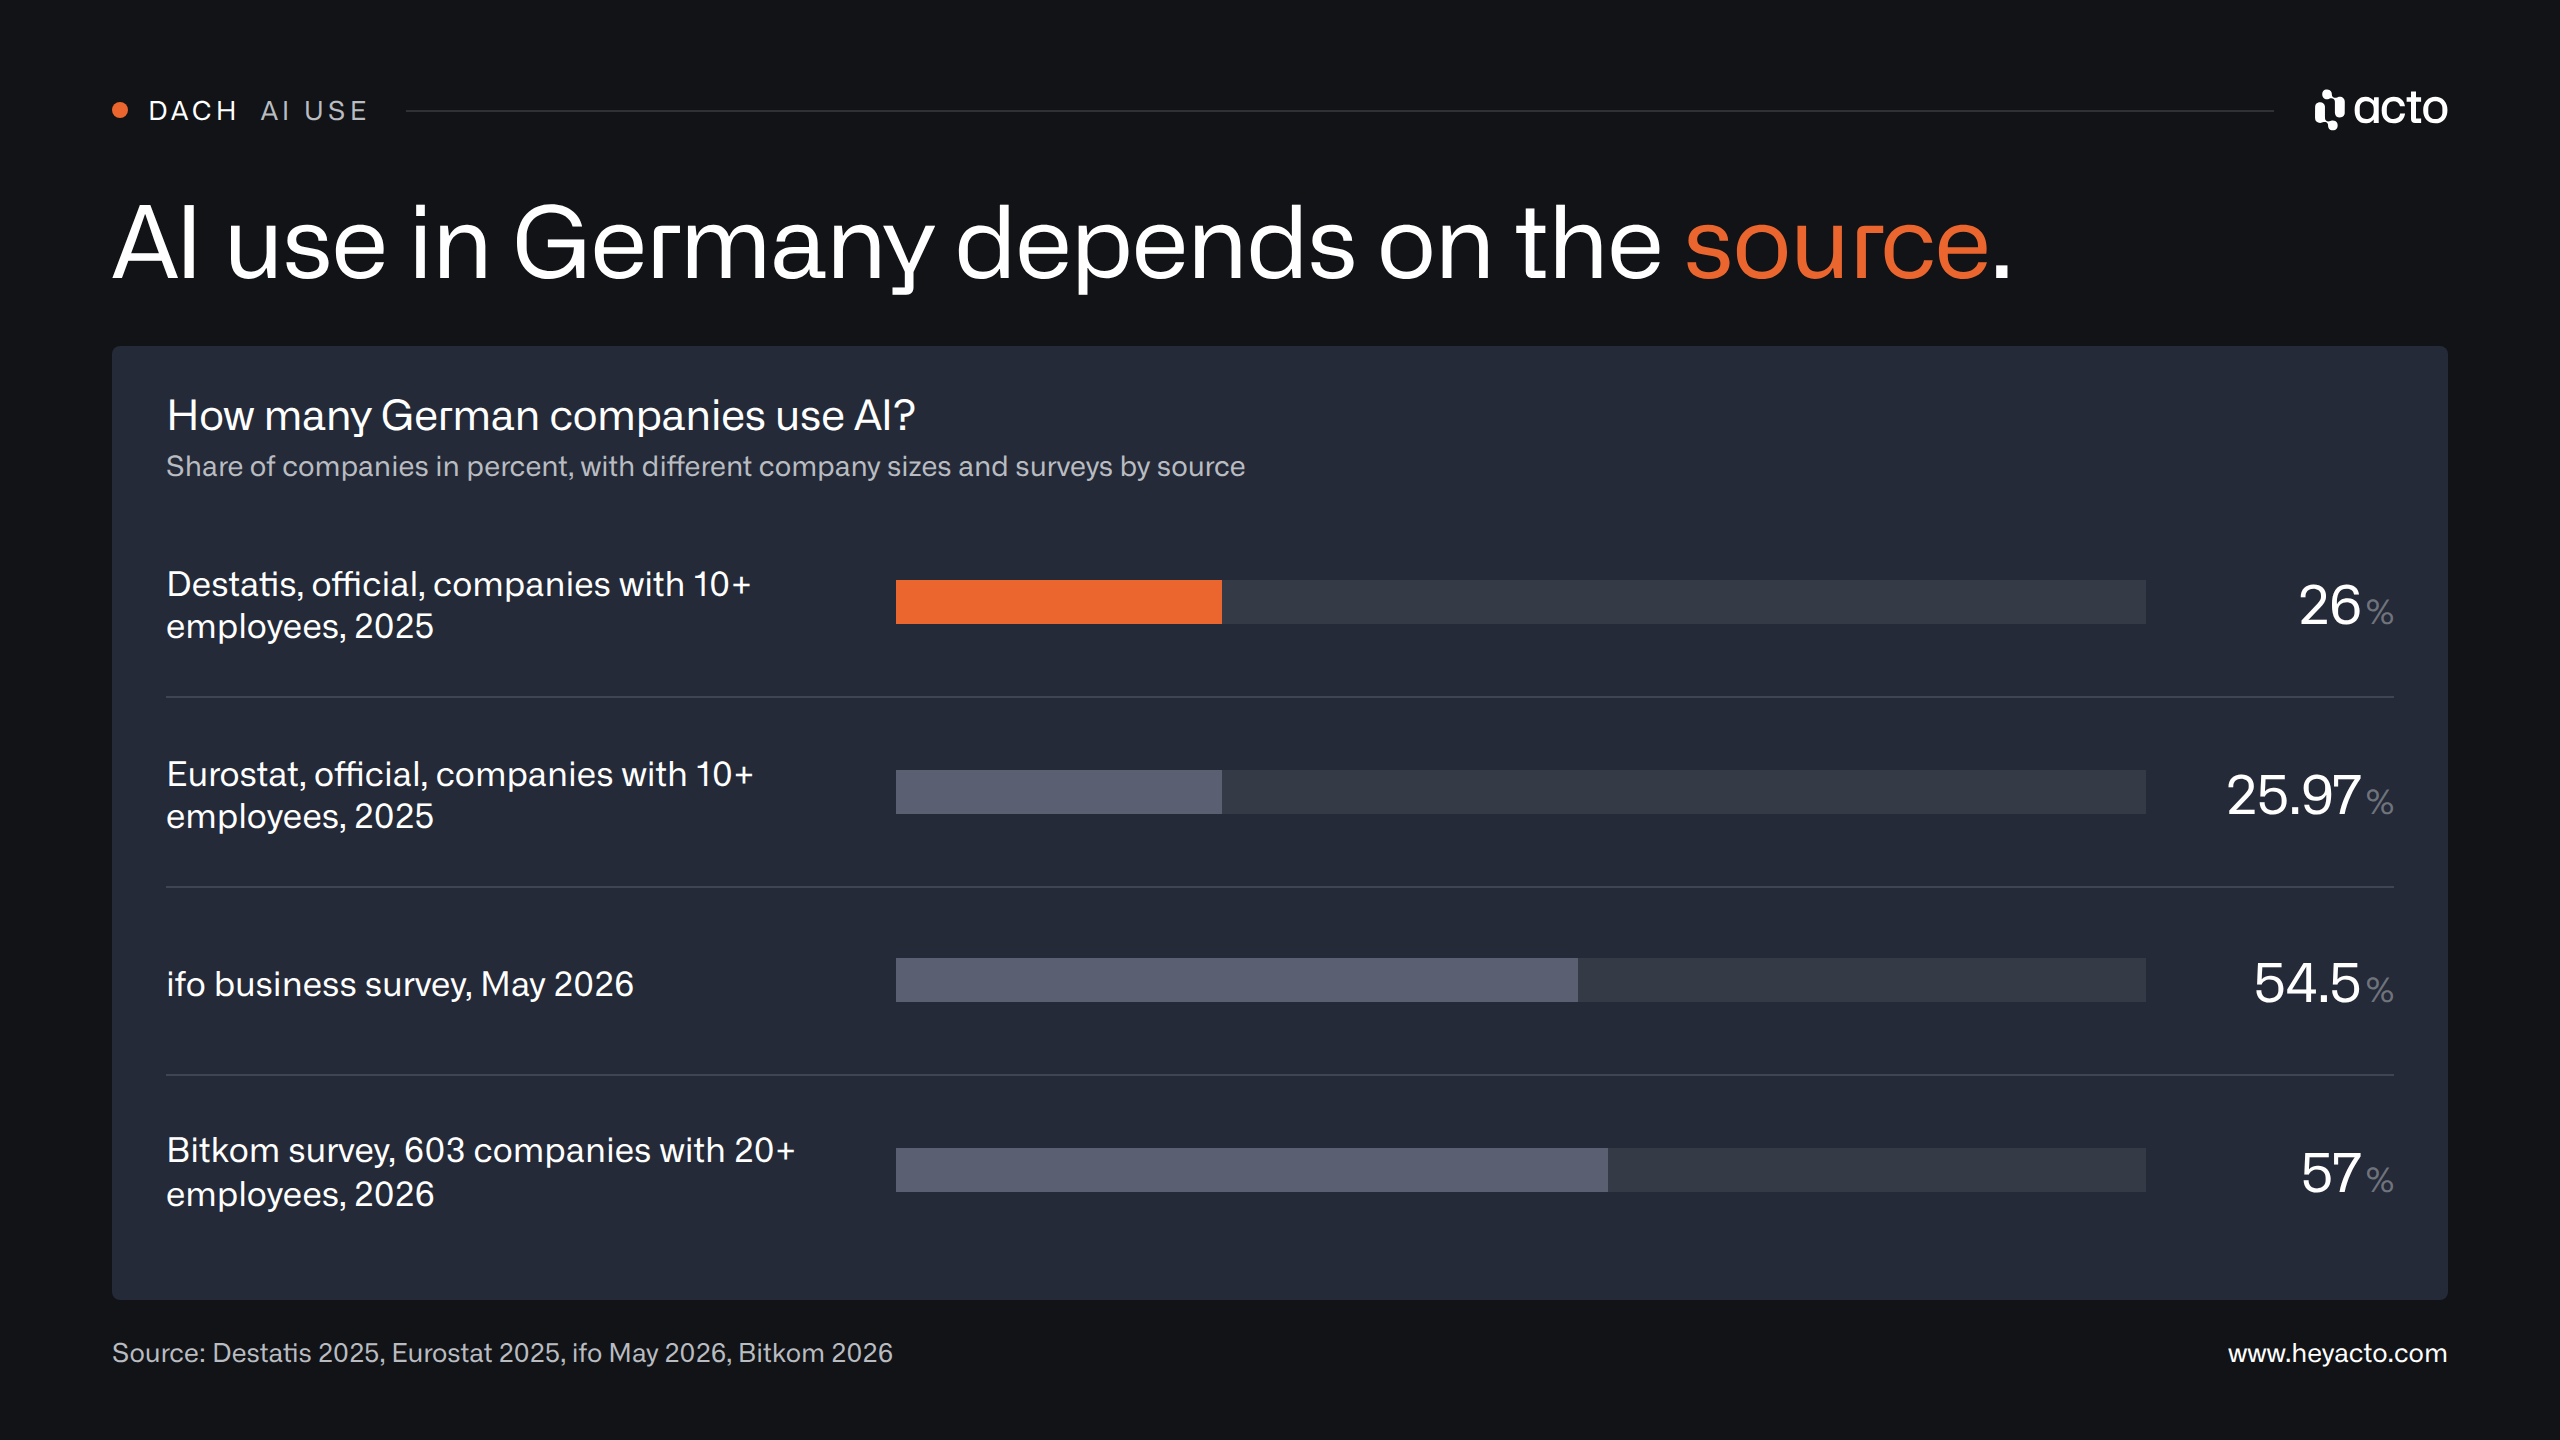
Official data and association surveys measure AI use differently: every figure needs its source and base.
The figures for Germany and Austria in detail:
- By size (Destatis 2025): 23% at 10 to 49 employees, 36% at 50 to 249, 57% at 250 or more
- Trend: AI use rose from 12% (2023) to 20% (2024) (Destatis); among users, marketing or sales is the most common use case at 33%
- Reasons against: 71% of companies that considered AI and rejected it cite lack of know-how, 58% unclear legal consequences (Destatis, 2024)
- Always state the base: Among AI users, 35.05% in Germany and 44.52% in Austria use AI in marketing or sales; measured against all companies, it's 9.1% in Germany, 13.33% in Austria and 7% in the EU (Eurostat, 2025)
- Austria ahead: Austria (29.95%) leads Germany (25.97%) and the EU (around 20%) in AI use (Eurostat, 2025)
- AI in sales (survey): According to Bitkom, use in sales rose from 5% to 14% within a year; 11% use AI agents and 29% plan to
- Efficiency losses: 25% of manufacturers and wholesalers see the biggest efficiency losses in sales and quoting, 31% in price adjustments and costing (ECC KÖLN, B2B-Marktmonitor 2026, 250 respondents)
- Need for AI agents: 64% of the same respondents see high demand for analyzing customer behavior and deriving actions (ECC KÖLN, 2026)
- Skilled labor: 36% of German companies can't fill all their vacancies, 32% in trade (prior year 38%) (DIHK-Fachkräftereport 2025/2026, more than 21,000 responses)
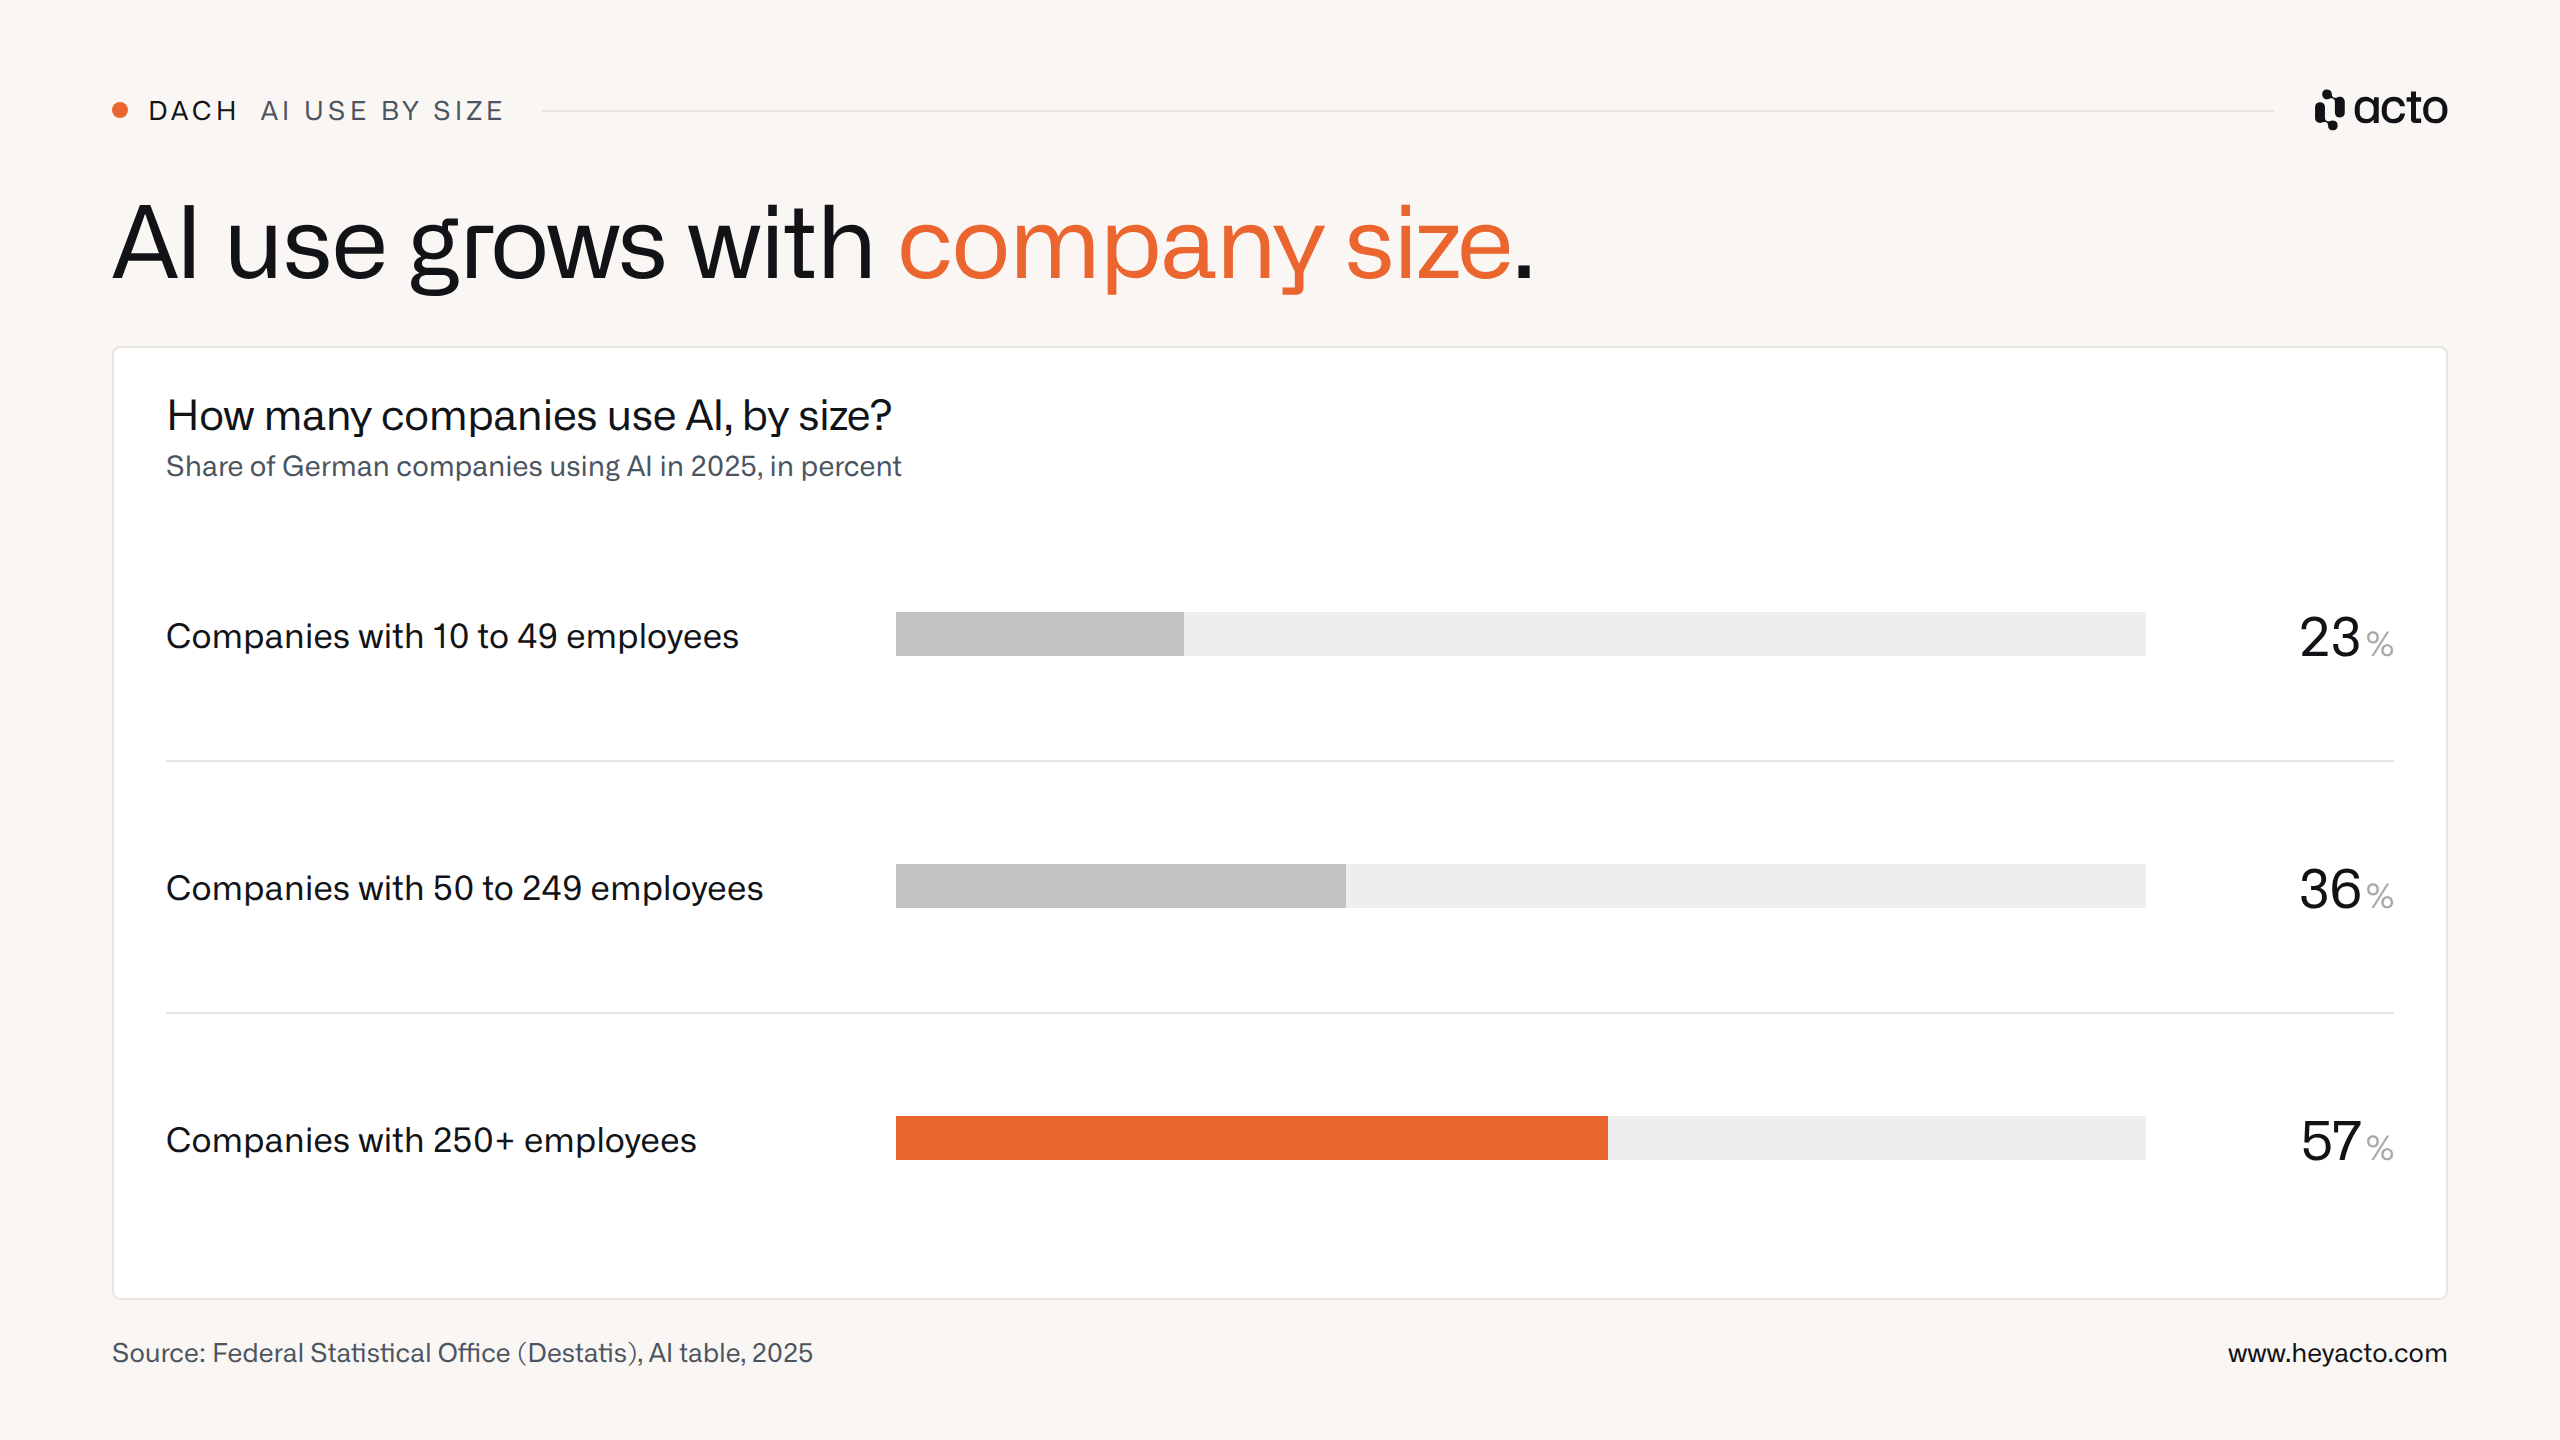
AI use grows with company size: 23% at 10 to 49, 36% at 50 to 249 and 57% at 250 or more employees. Source: Destatis, 2025
We don't have verified figures for Switzerland.
Figures you should stop quoting
Several of the most-quoted sales figures can't be traced back to any verifiable measurement. The table below shows what we found when we checked, and which figure you can use instead.
| No. | Claim | Usual attribution | What our check found | Reliable alternative |
|---|---|---|---|---|
| M1 | "80% of deals close after the 5th to 12th contact," "44% give up after one attempt" | National Sales Executive Association | According to SMEI, the successor organization, the 80% figure comes from a 1942 member survey by the Long Island chapter with fewer than 40 respondents; we found no study for the 44% | Instantly: 42% of cold-email replies come to follow-ups (platform data) |
| M2 | "A new customer costs 5 to 25 times as much as an existing one" | Gallo, Harvard Business Review, 2014 | HBR gives the range with the caveat "depending on which study you believe" and cites no study | Ebsta: 45% win rate for expansion versus 19% for new business |
| M3 | "A 5% increase in customer retention boosts profits by 25% to 95%" | Reichheld / Bain & Company | Bain's own 2006 page says "up to 95 percent" without method or base; the original 1990 HBR article wasn't accessible | Ebsta: expansion deals close after 52 days instead of 91 |
| M4 | "35% to 50% of sales go to the vendor that responds first" | InsideSales.com / MIT | No study with this figure could be found; the 2007 MIT work measured lead qualification by response time | No equivalent measurement known |
| M5 | "Reps spend only 28% to 33% of their time selling" | Older Salesforce editions, HubSpot | HubSpot cites 33% without its own data; older Salesforce editions are outdated | Salesforce, 7th edition: 40% (2025, n = 4,050) |
| M6 | "The probability of selling to an existing customer is 60% to 70%, to a new one 5% to 20%" | Farris et al., Marketing Metrics (book) | Book source only, appears exclusively on roundup pages | Ebsta: 45% vs. 19% win rate |
The M1 figure is older than any sales organization operating today. Put it in a budget request, and you're justifying a 2026 investment with the opinion of fewer than 40 sales managers from 1942.
What do the figures show for wholesale sales?
From here on, the focus is on wholesalers and manufacturers with their own direct sales force.
Most international sales benchmarks come from SaaS and tech pipelines; wholesale has its own official figures. The Bridge Group's sample is 83% SaaS companies, and Ebsta and Gong analyze the CRMs of customers who mostly come from the technology sector. According to Eurostat, German wholesale comprised 128,937 companies with 1.90 million employees and €1.29 trillion in net revenue in 2024.
The key wholesale figures from official and association sources:
- AI in wholesale: 32.36% of German wholesalers used AI in 2025, up from 21.67% in 2024 (Eurostat, 10 or more employees)
- Online revenue: Wholesale B2B online revenue was €303 billion in 2024 (ECC KÖLN, B2B-Marktmonitor 2025, projection)
- Ramp time: A new field rep needs three to five years to know their territory as well as an experienced colleague, according to the majority in a live poll at the VTH (2026, n = 52); according to Bridge Group, SaaS SDRs are considered ramped after 3.0 months, a different population with a different job
- Succession: 57% of Mittelstand business owners are 55 or older, up from 20% twenty years ago; trade accounts for 20.3% of handovers through 2030 while making up 15.7% of companies (KfW Nachfolge-Monitoring Mittelstand 2026; IfM Bonn, 2025/2026)
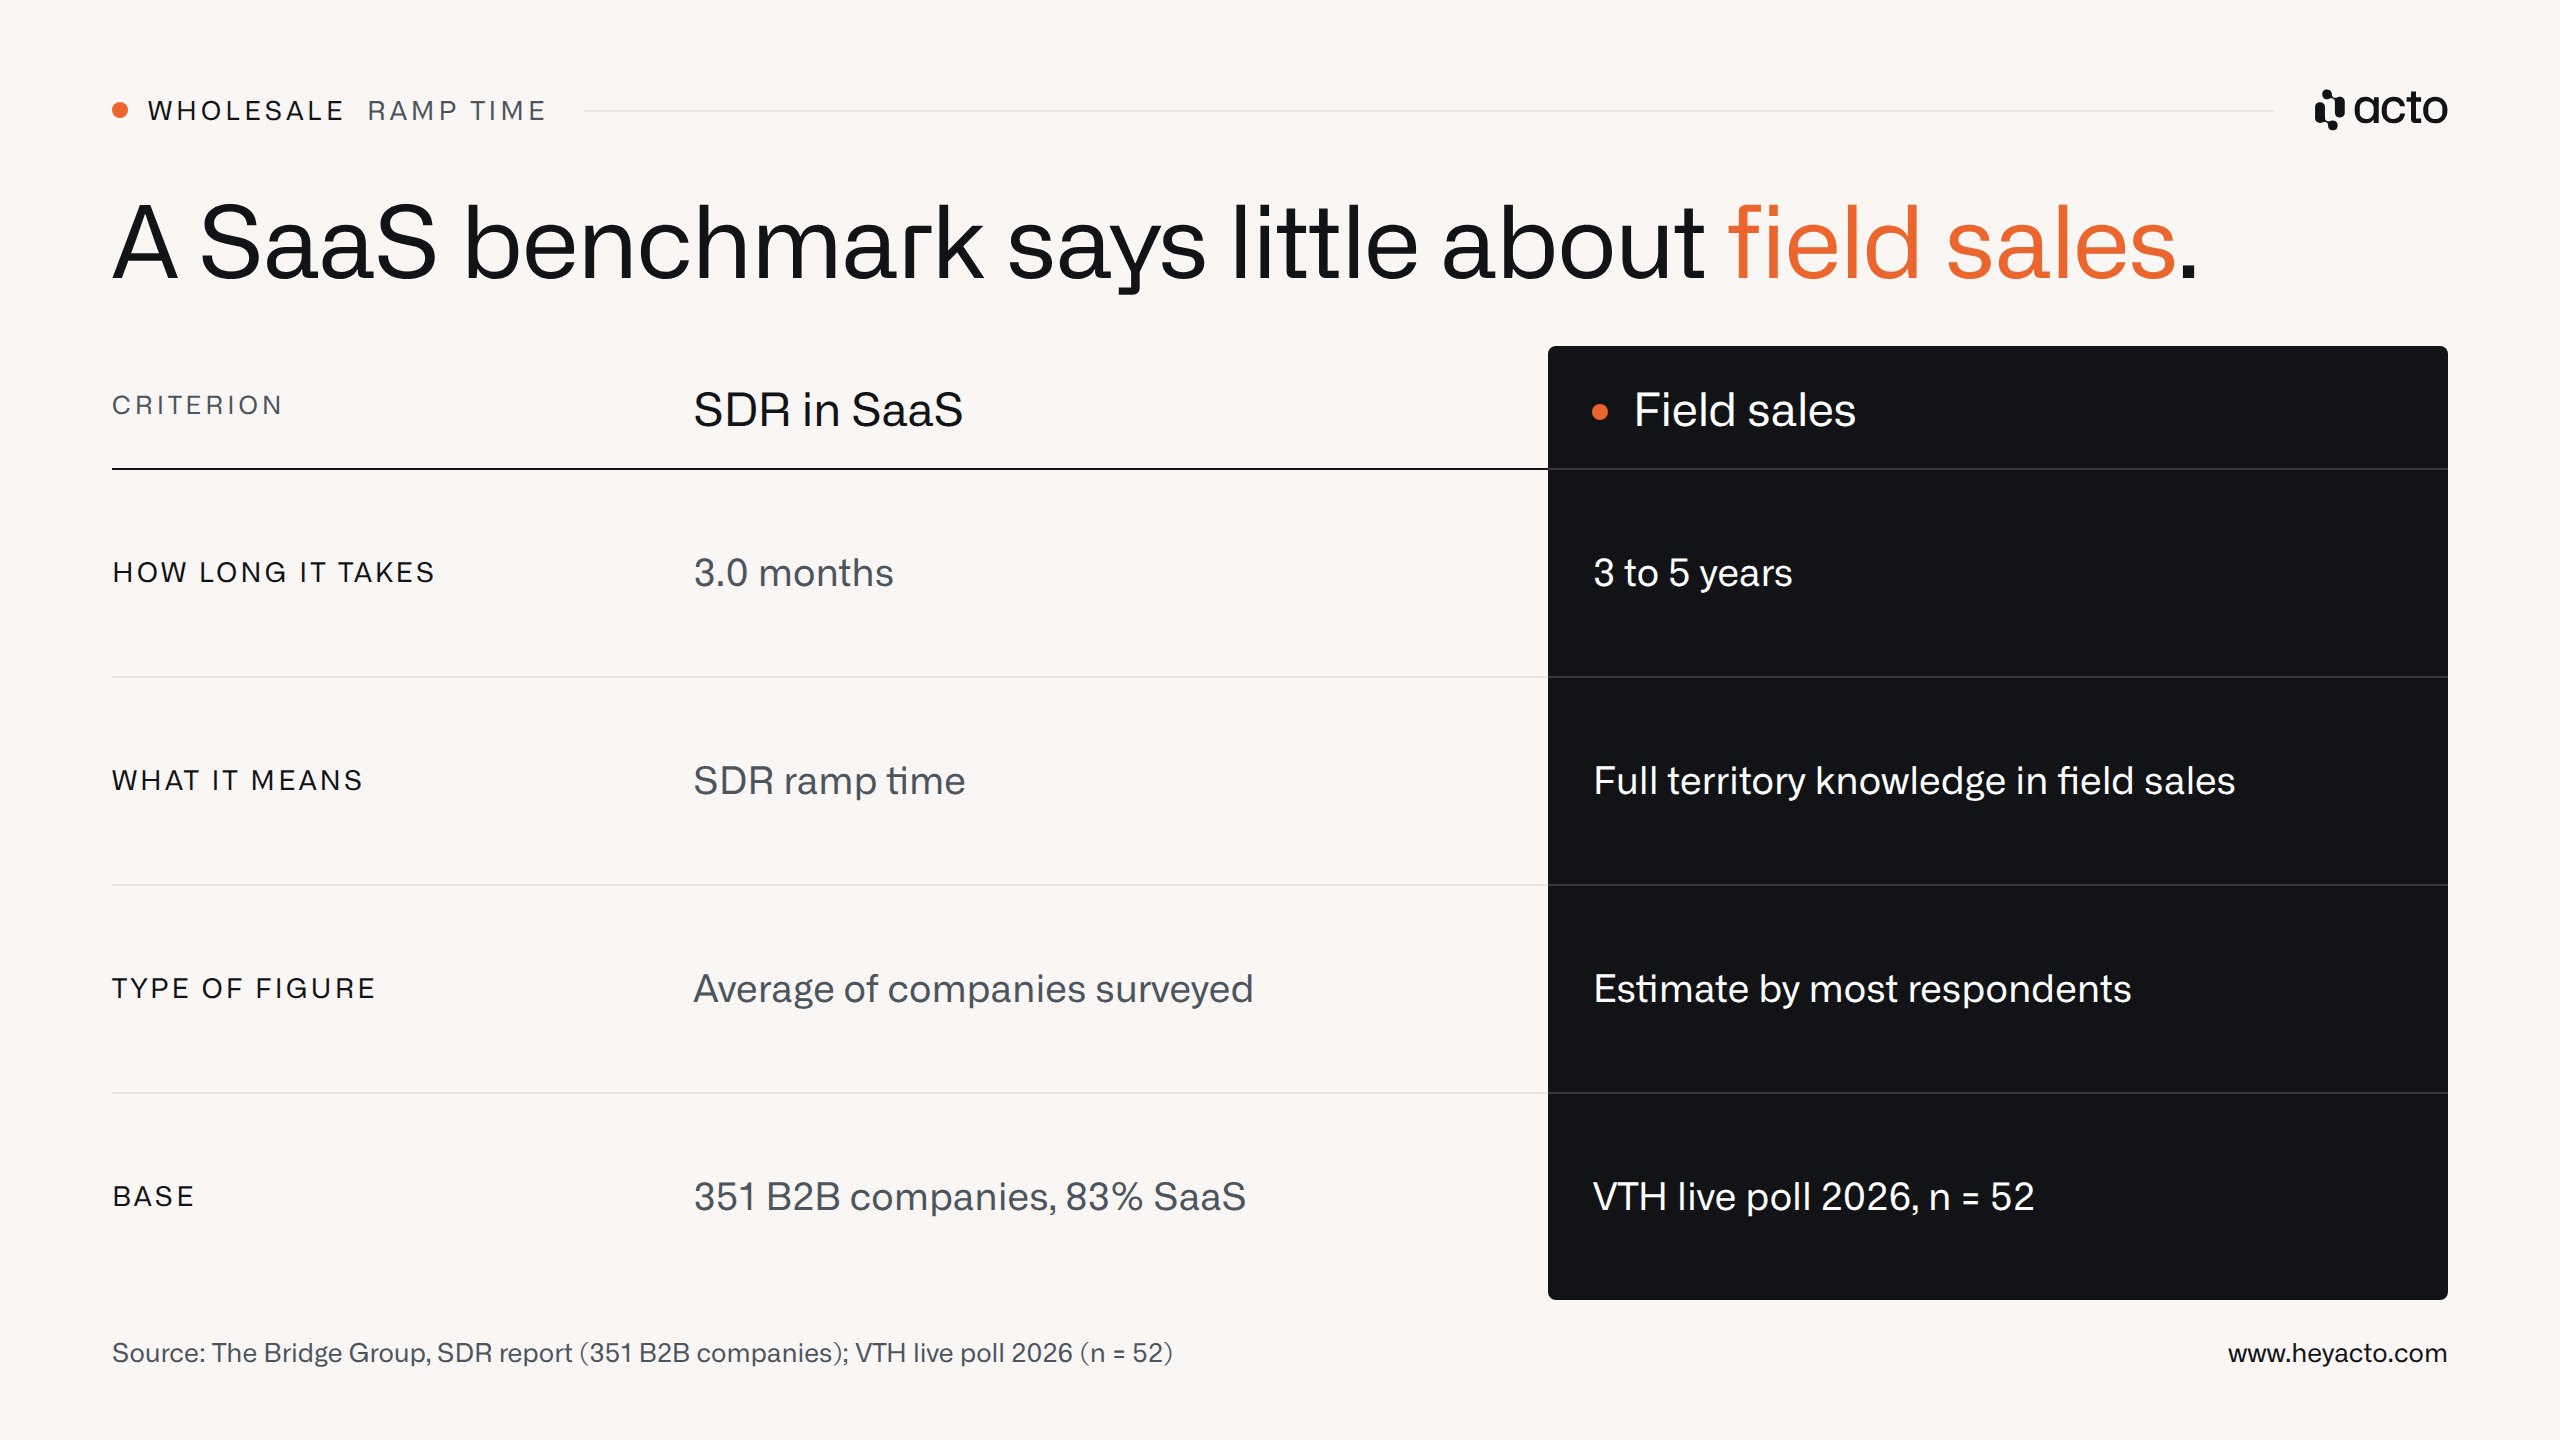
A SaaS ramp-time benchmark says little about field sales in wholesale.
At the start of 2026, the industry association summed up the situation in one sentence.
"The economic situation of German wholesale is dramatic."
– Dr. Dirk Jandura, President, BGA (press release "Großhandel in der Krise")
In a situation like this, the biggest lever is your existing customer base. Field sales revenue is revenue per visit times number of visits, and every sales initiative has to move one of those two factors. The benchmark for the second factor is the 40% selling time from the international Salesforce survey. The benchmark for the first is the 45% vs. 19% win rate from Ebsta's mostly tech-focused platform data: with customers who already buy.
Signals are the big hype in B2B sales right now. Software companies pay good money for website visits and buying signals, while wholesalers have been sitting on order history in their ERP for years and barely use it. As a result, many sales meetings never answer the question of which customer is genuinely overdue for a reorder.
Sales already keeps a close eye on the top 20% of customers. The interesting ones sit below them: customers who quietly buy less until purchasing eventually asks why an item isn't being ordered anymore.
Our own data: the "Wholesale Field Sales 2026" study
The following figures on customers per field rep come from our own study "Wholesale Field Sales 2026", based on 106 wholesale companies (92 from our sales conversations, 14 from our own survey, 2024 to 2026). The sample isn't representative and covers wholesale in German-speaking countries.
- Customers per field rep: 247 on average, median 175
- Range: 64 of 106 companies report 200 customers or fewer per field rep; nine report more than 500
- Visits: around six visits a day (median of 42 mentions in conversations)
- Visit planning: In 47% of conversations with wholesalers, gut feeling is named as the basis for visit planning, the CRM in 8%; only 11% mention an early-warning list for customers who are buying less
- Churn: According to our churn benchmark based on ERP order data, wholesalers lose 4% to 17% of their customers each year
- Cost: By our own calculation, a field rep costs around €98,000 a year; we break down how we arrived at that figure in our calculation of the cost of a field sales visit
With 175 to 247 customers and six visits a day, a field rep sees each customer only a few times a year, and reps who plan from experience drive to the customers they already know. More figures from the study are in our article Wholesale sales in numbers, and how to plan visits by signal rather than a fixed schedule is covered in Plan visits by potential.
What Acto does with this data
Acto is a sales AI for wholesale, built for wholesalers and manufacturers with their own direct sales force. Every night, Acto analyzes ERP order data, and every morning it shows field reps which customers need attention today and why.
- Churn: Customers whose order rhythm or revenue is slipping before they stop buying altogether
- Assortment gaps: Product groups that comparable customers buy but this customer doesn't
- Reorders: Items whose usual order interval has been exceeded
The alerts appear in Outlook, as a sidebar in the CRM or in the app, as a prioritized list with a one-sentence rationale.
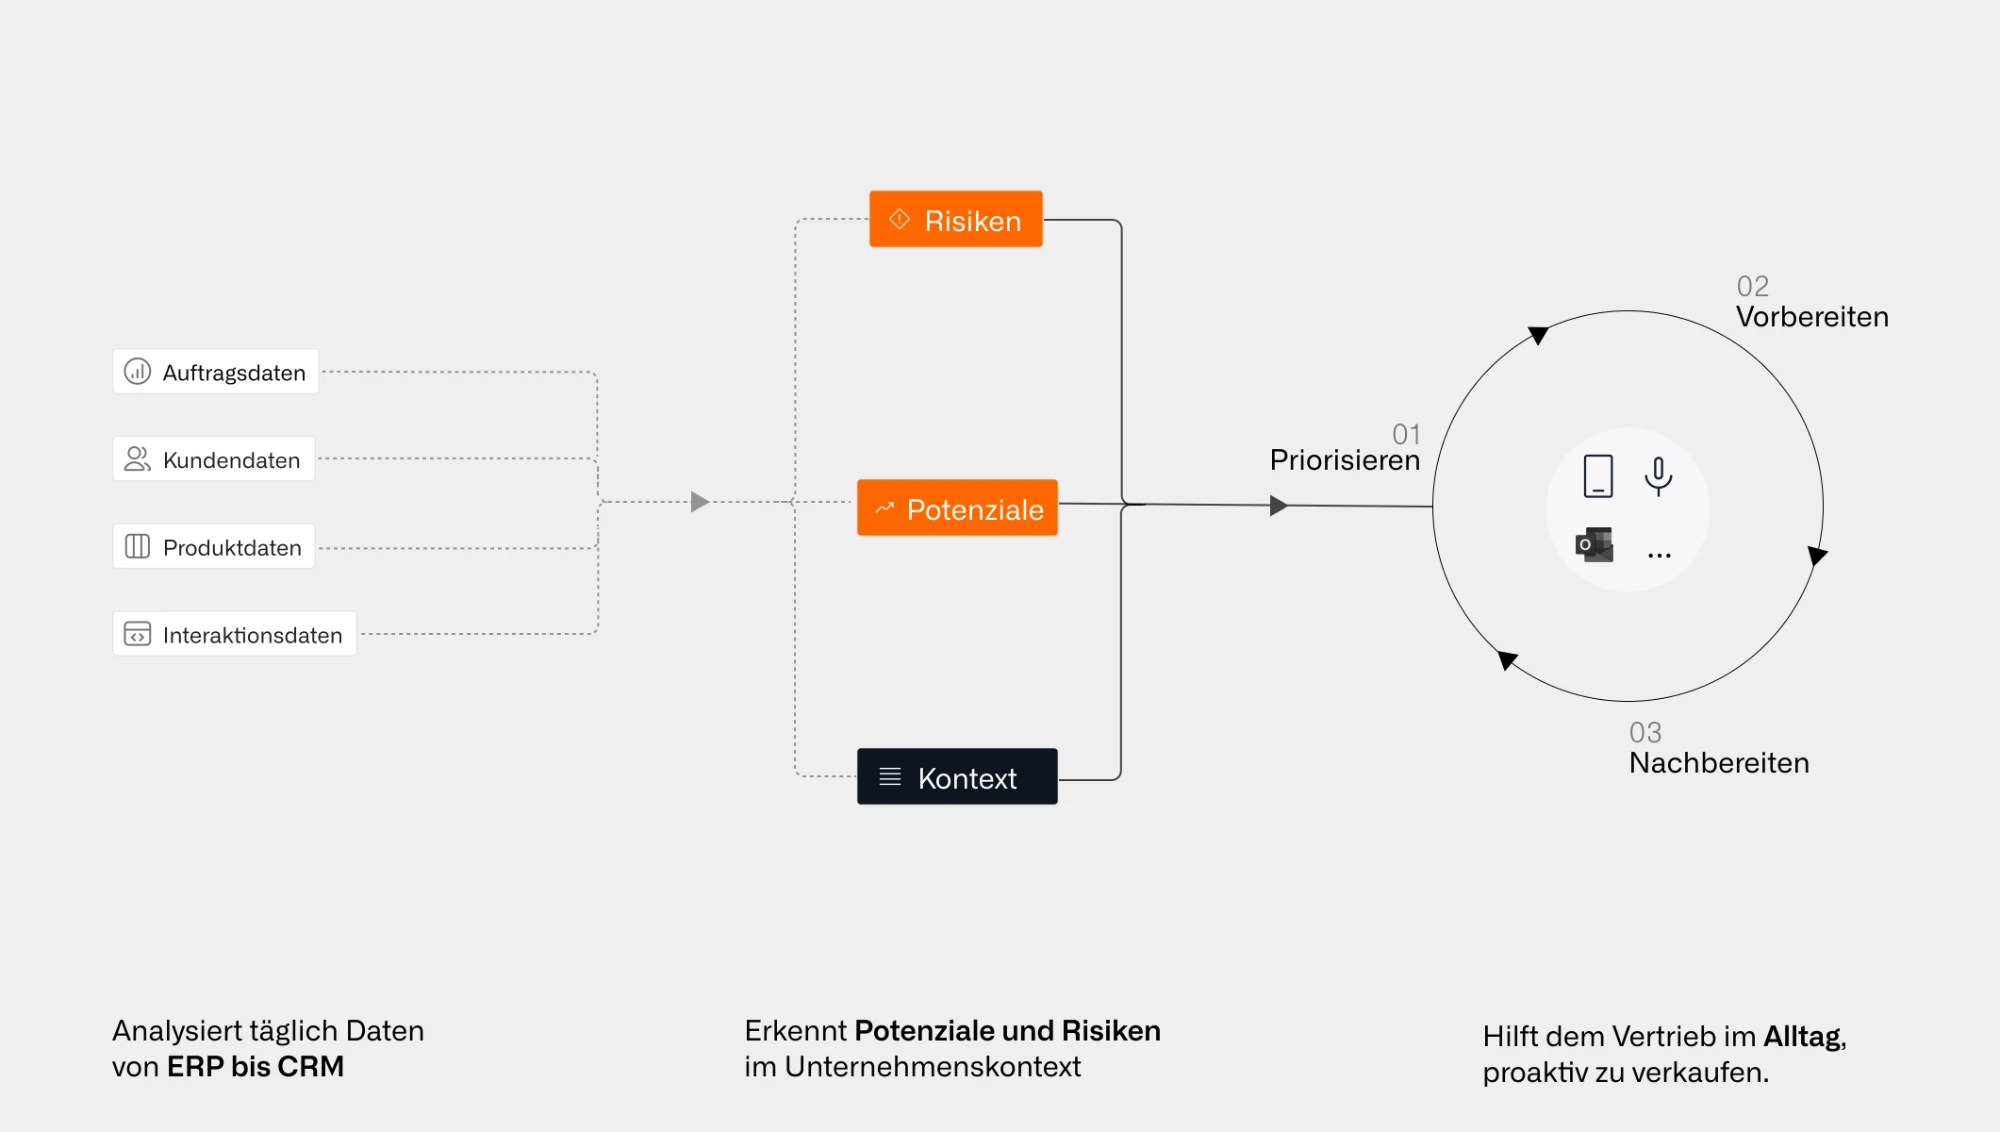
Order, customer, product and interaction data become risks and opportunities that sales uses to prioritize, prepare and follow up.
Not for you: when these figures won't support your decision
The figures on this page give you a sense of the market; for your company, they replace neither your own benchmark nor proof of cause and effect. There are five limits you should know before putting any of them in a proposal:
- US and SaaS origin: Benchmarks on win rate, quota and deal size come mostly from North American software pipelines.
- Platform data: Ebsta, Gong and Instantly only show their own customers, i.e. companies already investing in such tools.
- Self-reported data: HubSpot figures are sales professionals' own estimates.
- Business model: For project business without reorders and for B2C, the figures on existing-customer business and the wholesale data carry little weight.
- Your own numbers: If you want to justify an investment, you'll also need figures from your own ERP and CRM.
How were the figures selected and verified?
Every figure on this page was read on the publisher's original page or PDF before publication. We included primary sources with a known survey year and known base, generally no more than three years old.
Our selection rules:
- Excluded: Statistics roundup pages, figures from field sales software vendors, Gong's comparison of AI users with non-users within its own product (selection effect) and US figures covering all sales occupations including retail
- Older figures: only with the year stated, such as Eurostat's 2021 CRM usage
- Labelling: platform data, self-reported, survey by a CRM vendor or official statistics
- Contradictions: Different measurements of the same metric sit side by side and are never combined; relative changes are never called percentage points
How to cite this page
You can use this citation line:
"B2B Sales Statistics: Verified Figures with Sources. heyacto.com, accessed on (date you accessed it)."
When citing an individual figure, please also cite the primary source linked to that figure.
Put your latest sales deck next to the myths table and replace every figure lacking a publisher, year and base with one from this page. If you sell in wholesale, add the figures from our "Wholesale Field Sales 2026" study.
In a call, we'll show you where revenue from existing customers is being left on the table in your own order data.
FAQ
Which figure should I show the board when two studies contradict each other?
For a board paper, use the figure with the largest base and the most recent survey year, and show the other measurement alongside it. For selling time, that's Salesforce at 40% (2025, 4,050 respondents), with HubSpot and Ebsta for comparison. Show only one figure and leave out the counter-measurement, and you'll lose the room at the first critical question.
What is the online share of German B2B trade?
Total B2B e-commerce including EDI exceeded €2.0 trillion in Germany in 2025, meaning just under 30% of revenue runs through online channels (ECC KÖLN with CGI and Intershop, B2B-Marktmonitor 2026, projection). Measured by share of companies, the picture looks different: only 13.96% of German companies sell to businesses or public-sector buyers via a website, app or marketplace, 23.11% have any e-commerce revenue at all, and 5.59% sell via EDI (Eurostat 2025, 10 or more employees).
How much does a B2B sales rep earn?
Official figures exist for the US: according to the US Bureau of Labor Statistics occupational data, sales reps in wholesale and manufacturing earn a median of $76,460 (2025), and sales managers earn $148,270 according to the BLS occupational profile. According to Bridge Group, SDRs have a median on-target earnings of $80,000 ($55,000 base, $25,000 variable), unchanged since 2022; the survey covers 351 B2B companies, 78% in North America and 83% SaaS. We don't have a verified comparison figure for Germany for this page.
How many companies in Germany use a CRM?
According to Eurostat, 44.58% of German companies used CRM software in 2021, in each case based on companies with ten or more employees (EU 34.8%, Austria 45.9%); 2021 is the last year for which Eurostat published this figure. The often-quoted 23% from Destatis refers to CRM and ERP as a paid cloud service (2025) and says nothing about CRM use overall.
How many sales agencies and field reps are there?
According to Eurostat, Germany had 38,264 sales agencies with 102,154 employees in 2024. In the US, around 1.57 million sales reps work in wholesale and manufacturing, with a median age of 44.2 years (all workers: 42.1). Despite flat employment, around 123,400 openings are projected there each year through 2035 (BLS).