Detecting Customer Churn in Wholesale: 13 Signals

Summary
- In wholesale, churn shows up first in individual product groups. A customer's total revenue often looks stable for months.
- The simplest early-warning metric is the order interval ratio: days since the last order divided by the customer's usual order interval. Anything above roughly 1.5 is worth a second look.
- Several signals together make up a weekly score per customer. To get started, all you need is Excel and the order data from your ERP.
- A field study in B2B wholesale shows that targeting the customers at highest risk reduces churn far more than contacting customers at random.
- A signal without context is a false alarm. A customer who hasn't ordered for three weeks may be churning or may simply be closed for company vacation.
Last updated: October 2026
Why is customer churn in wholesale often noticed too late?
Because a customer's total revenue looks healthy for a long time while, behind the scenes, one product group after another drops off. Standard items keep selling, special orders went to the competition long ago, and the monthly report doesn't show it.
Unlike a subscription, wholesale has no moment when a customer cancels. They just order less and less, shifting product groups to competitors until only the bare essentials are left. Our churn benchmark shows how big the difference is: depending on how well they take care of their customers, wholesalers lose between 4 and 17 percent of their customers per year.
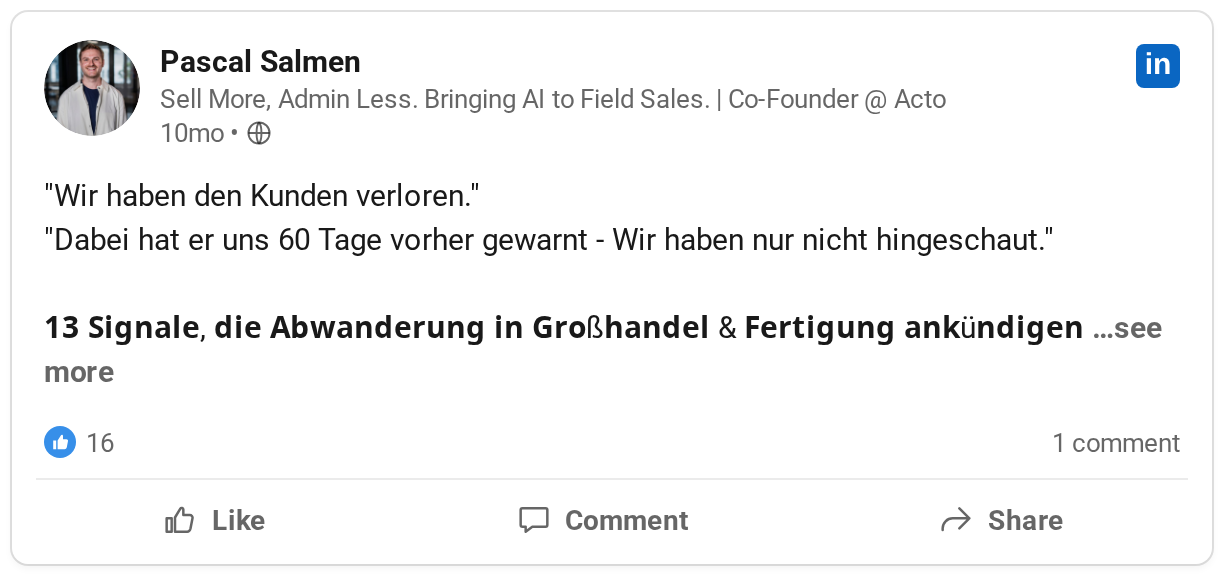
Our co-founder Pascal Salmen described it like this on LinkedIn:
Every customer you keep counts double: according to a widely cited analysis in the Harvard Business Review, winning a new customer costs five to 25 times as much as keeping an existing one.
In conversations with customers, we hear this pattern again and again:
"Sometimes we just don't notice fast enough when someone gradually starts buying less […] And when he stops buying it altogether, it often takes us too long to notice. We catch it eventually, but by then maybe 2 months have gone by." (Contact at a wholesaler, customer interview, 2026)
How do you recognize customers who are churning? 13 signals
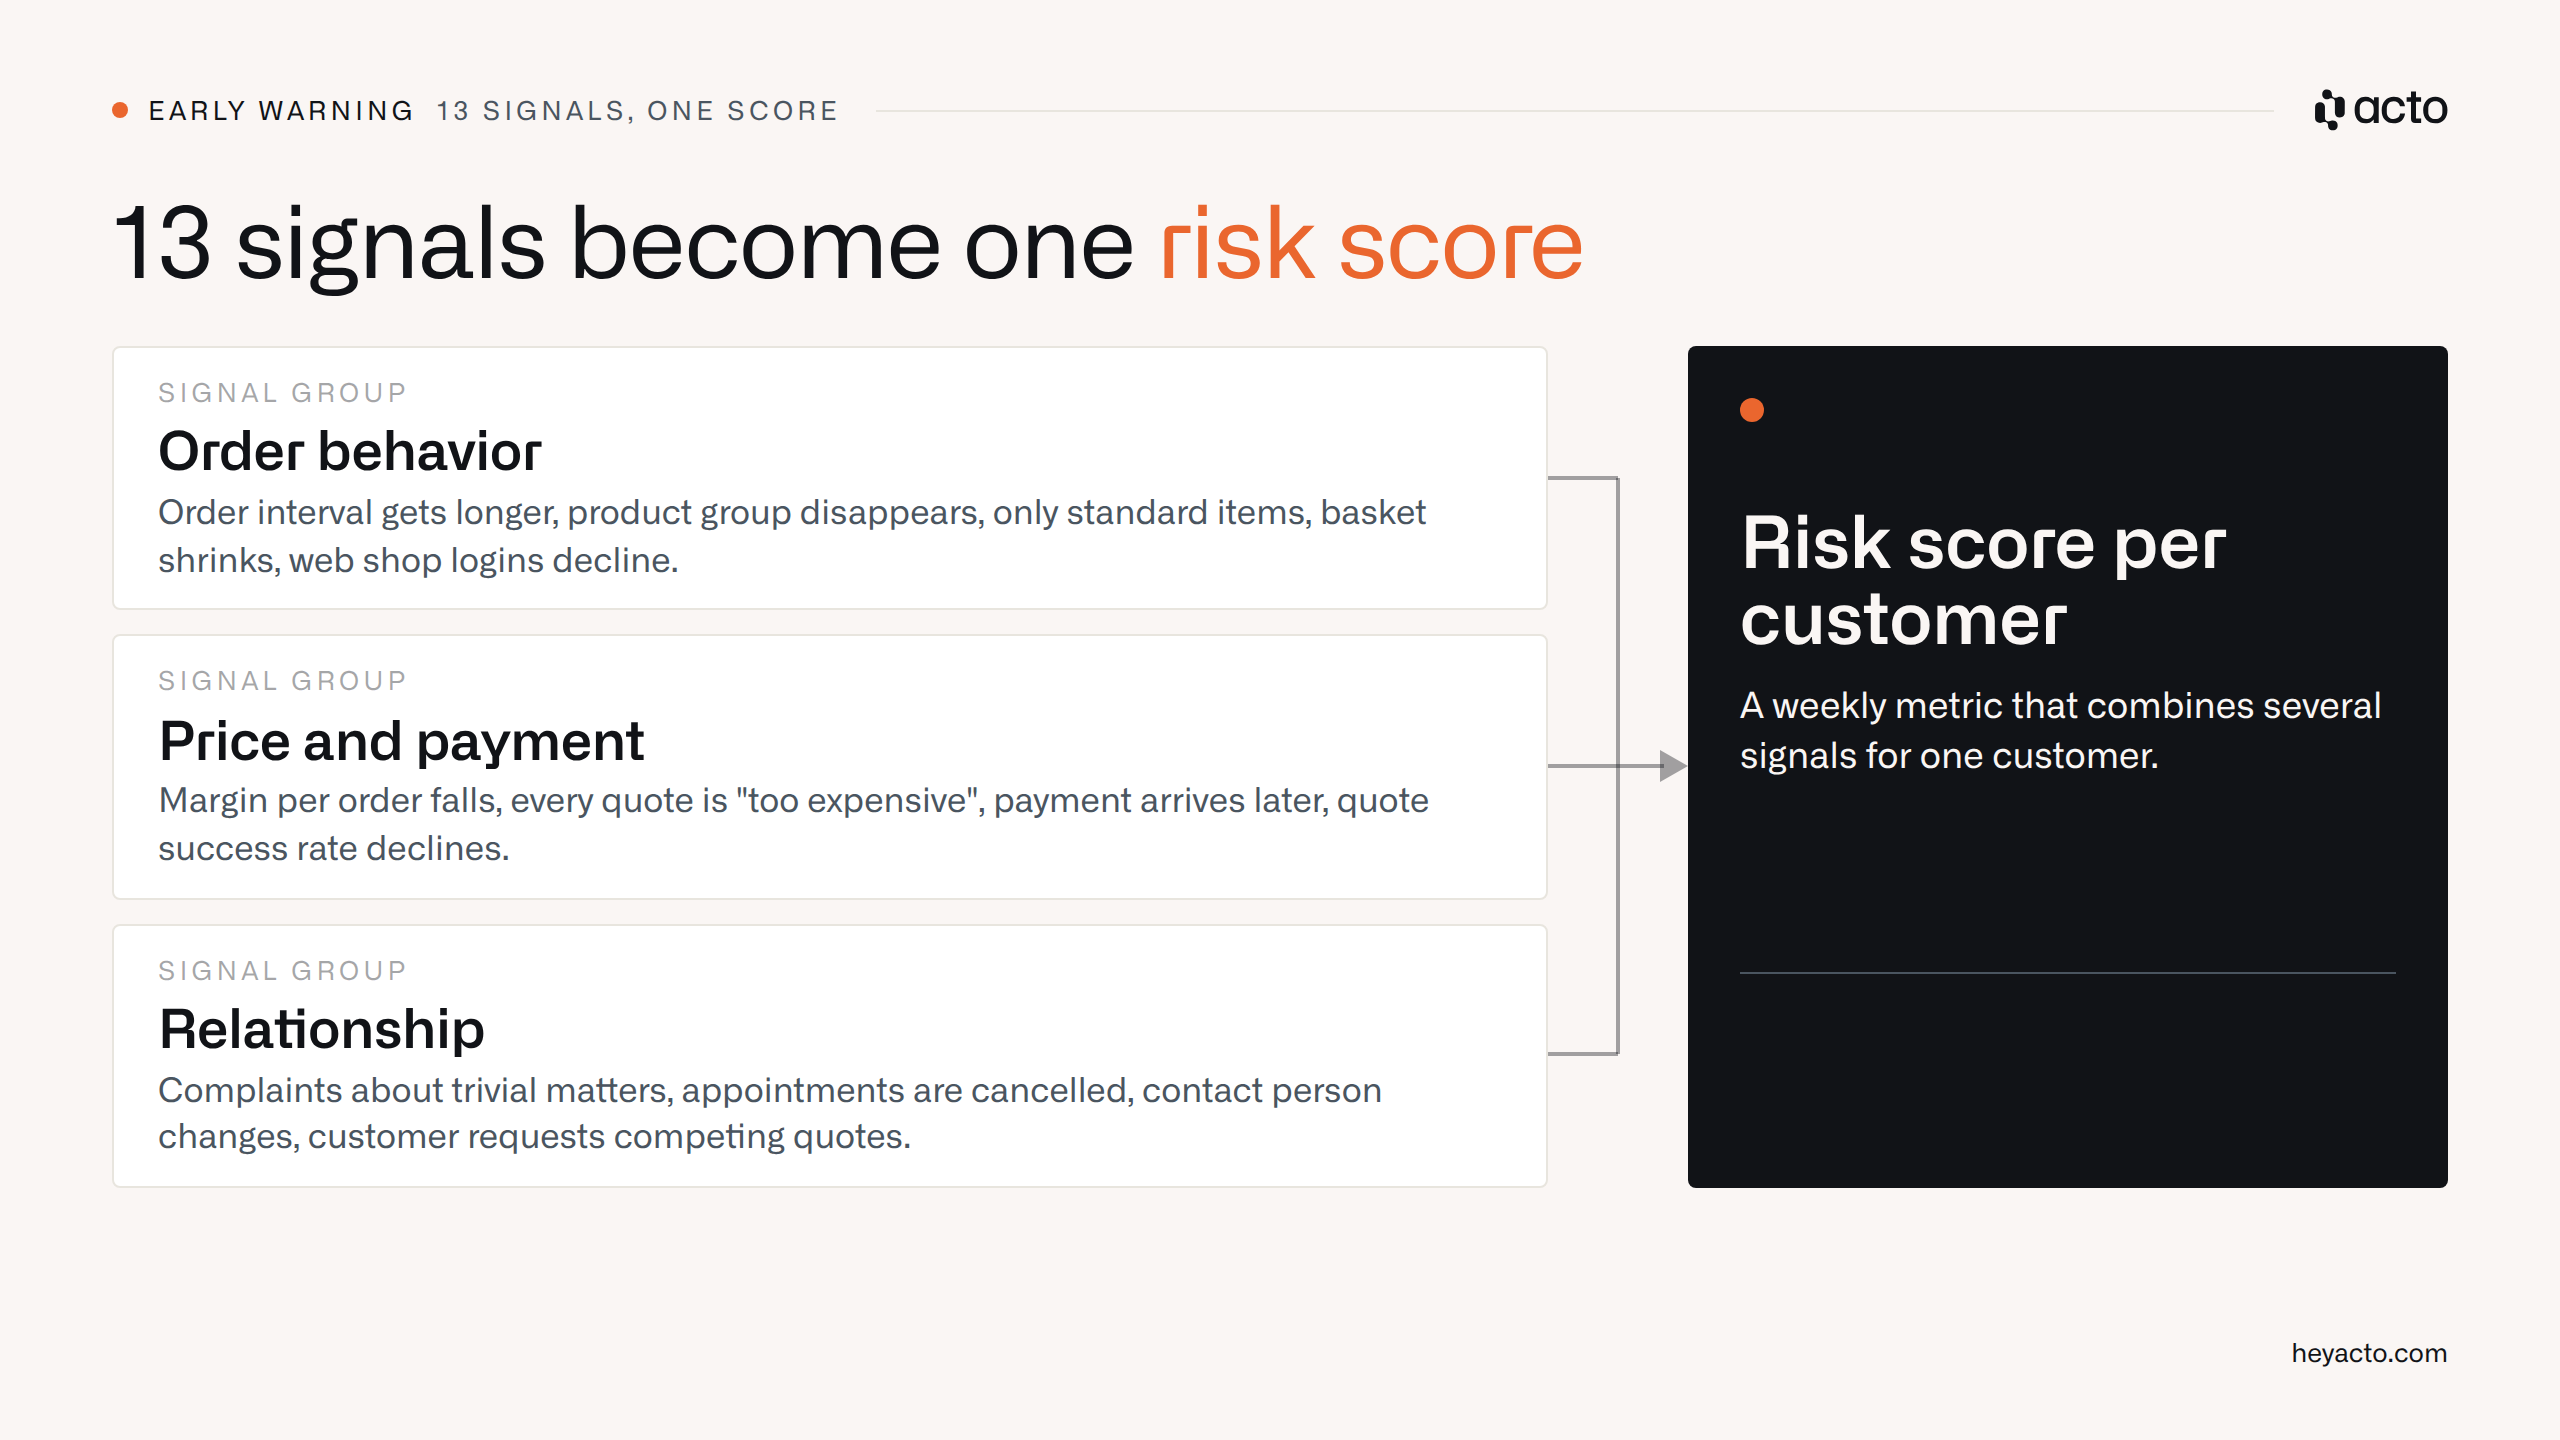
Churn shows up as a deviation from each customer's own normal pattern, not in their total revenue. The following 13 signals come from three sources: order behavior in the ERP, price and payment, relationship and communication. The thresholds in the table are starting values. Calibrate them against your own customer history.
| # | Signal | How to spot it | Source |
|---|---|---|---|
| 1 | Order interval gets longer | Order interval ratio above 1.5 | ERP |
| 2 | Product group disappears | Core product group not ordered for several order cycles | ERP |
| 3 | Only standard items | No special orders for months | ERP |
| 4 | Basket shrinks | Fewer active items per order than in the same period last year | ERP |
| 5 | Web shop logins decline | Login activity below the customer's own normal pattern | Web shop |
| 6 | Margin per order falls | Revenue stable, contribution margin declining | ERP |
| 7 | Every quote is "too expensive" | Price objections to terms the customer used to accept | Sales |
| 8 | Payment arrives later | Payment terms repeatedly exceeded | ERP |
| 9 | Quote win rate declines | Fewer quotes turn into orders than usual for this customer | ERP / CRM |
| 10 | Complaints about small things | Several small complaints without a clear technical reason | Service |
| 11 | Appointments get canceled | Repeated short-notice cancellations without a replacement date | Sales |
| 12 | Contact person changes | New decision-maker without a handover conversation | Sales |
| 13 | Customer requests competing quotes | Active inquiries about terms and alternatives | Sales |
Which signals show up in order behavior?
In their order data, churning customers mostly give themselves away through longer order intervals, disappearing product groups and a retreat to standard items. A painter who has ordered paint, brushes and masking film for years but never filler or masking tape is buying those items elsewhere, often because nobody ever asked. In foodservice, wine disappears first, then spirits, while beer and soft drinks keep total revenue stable.
Which signals show up in relationship and communication?
Long before a customer leaves, the tone changes: appointments get canceled, emails take longer to answer, a new buyer doesn't know the field sales rep. A sales manager at a plumbing and heating (SHK) wholesaler told Pascal Salmen what this means for mid-sized customers, and Pascal shared it on LinkedIn:
"Our B and C customers don't really feel taken care of. We only react when something goes wrong." (Sales manager, SHK wholesale)
How do you calculate the order interval ratio?
Divide the days since the last order by the customer's usual order interval. A value around 1 is normal; anything above roughly 1.5 is worth a second look. For the usual interval, use the median of the last twelve months, not the average, so a few outliers don't skew the picture.
| Customer | Usual order interval | Days since last order | Ratio | Meaning |
|---|---|---|---|---|
| A | 14 days | 15 days | 1.07 | normal |
| B | 21 days | 28 days | 1.33 | keep watching |
| C | 14 days | 25 days | 1.79 | follow up |
The values in the table are a worked example. The ratio only measures how far a customer deviates from their own rhythm. On its own, it doesn't tell you whether churn is behind it.
How do you build an early-warning score?
An early-warning score combines several signals per customer into a weekly metric. It answers one question: is this customer currently deviating more than usual from their own behavior? In the industry literature, this is often called a customer health score.
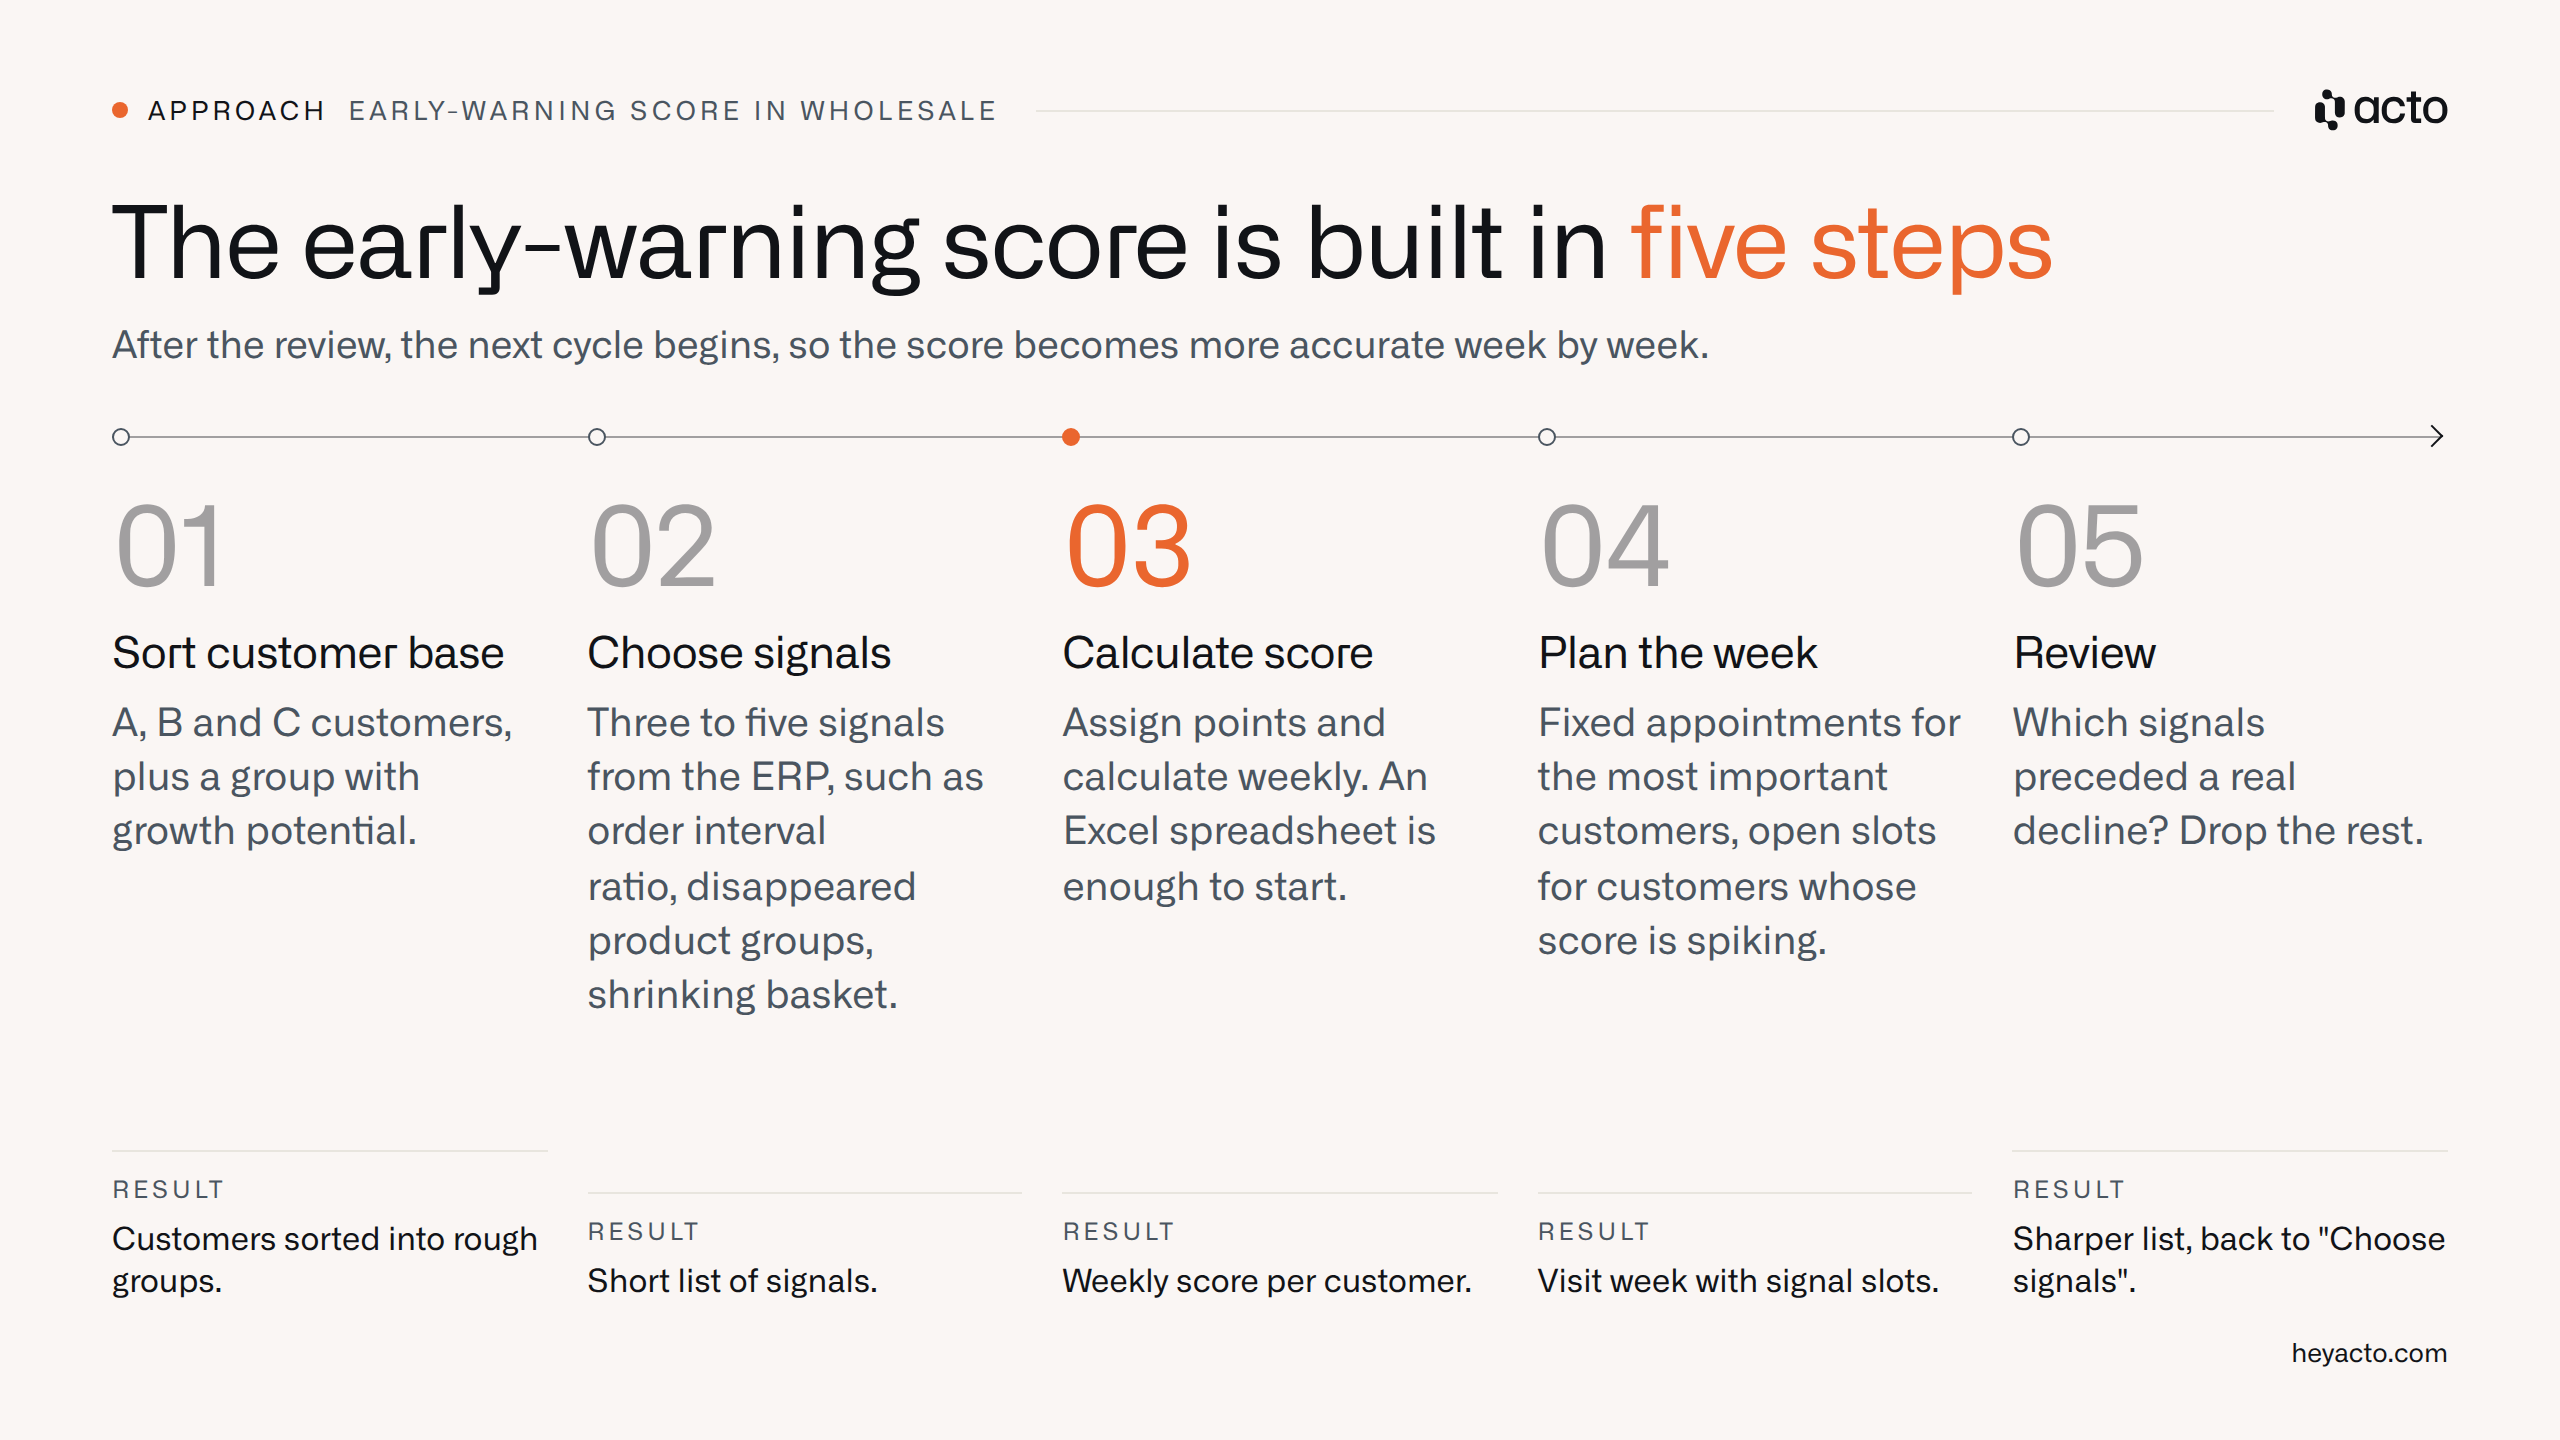
Setting one up takes five steps:
- Segment your customer base roughly: A, B and C customers, plus a group with growth potential.
- Choose three to five signals from the ERP: order interval ratio, disappeared product groups, shrinking basket.
- Assign points and calculate weekly: an Excel spreadsheet is enough to start.
- Plan the week with signal slots: fixed appointments for the most important customers, plus open slots for customers whose score is spiking.
- Review after a few weeks: which signals preceded a real decline? Drop the rest.
Gradual changes often show up only when you compare several time windows, such as 1, 3 and 6 months. One weak month isn't a signal yet; a gap that widens over six months is. Also check the share of wallet: a customer who covers only a small part of their needs with you has more to lose than their revenue suggests.
Does early detection measurably pay off?
Yes: targeting at-risk customers measurably reduces churn, as long as there's a concrete reason for reaching out.
In a field study by the University of Cologne in B2B wholesale, Gattermann-Itschert and Thonemann tested a prediction model: targeting the customers with the highest predicted churn probability reduced churn far more than contacting randomly selected customers, and revenue performed better. Alongside order interval, frequency and revenue, one of the strongest predictors was how long it had been since field sales last contacted the customer.
But there's a flip side. A study by Ascarza and colleagues outside wholesale found that proactive outreach without a trigger can even cause churn: in their field experiment, 10 percent of the customers contacted churned afterwards, versus 6 percent in the control group. Our takeaway: calling for no reason can backfire. Calling about a concrete signal helps.
That requires context. A customer hasn't ordered anything for three weeks. Without context, the signal reads "at risk of churning, call immediately". With context, it reads "no alarm, company vacation until mid-September, follow up afterwards". Only field sales has this context, which is why their feedback belongs in every early-warning system.
What should you do when a customer gets flagged?
Know the exact signal before you visit the customer, and ask a specific question instead of a general one. For example: "I noticed you haven't ordered any fasteners from us in two months. Has something changed?"
Then find the cause: price, delivery reliability, a new buyer, a competitor or a change at the customer's own company. Only the cause tells you how to respond. A price problem calls for a conversation about terms; a new buyer, an introductory meeting; a business closure, nothing more than a data clean-up.
At many mid-sized wholesalers, visit frequency depends on customer size: large customers almost weekly, smaller ones quarterly. That's exactly where the gap opens up: by the next quarterly visit, a small customer with a growing assortment gap has long since started ordering elsewhere. Our article Preventing customer churn: 12 measures covers how to respond when a customer is already about to leave. For the metrics that steer field sales as a whole, see our article on field sales KPIs.
How Acto makes churn signals visible
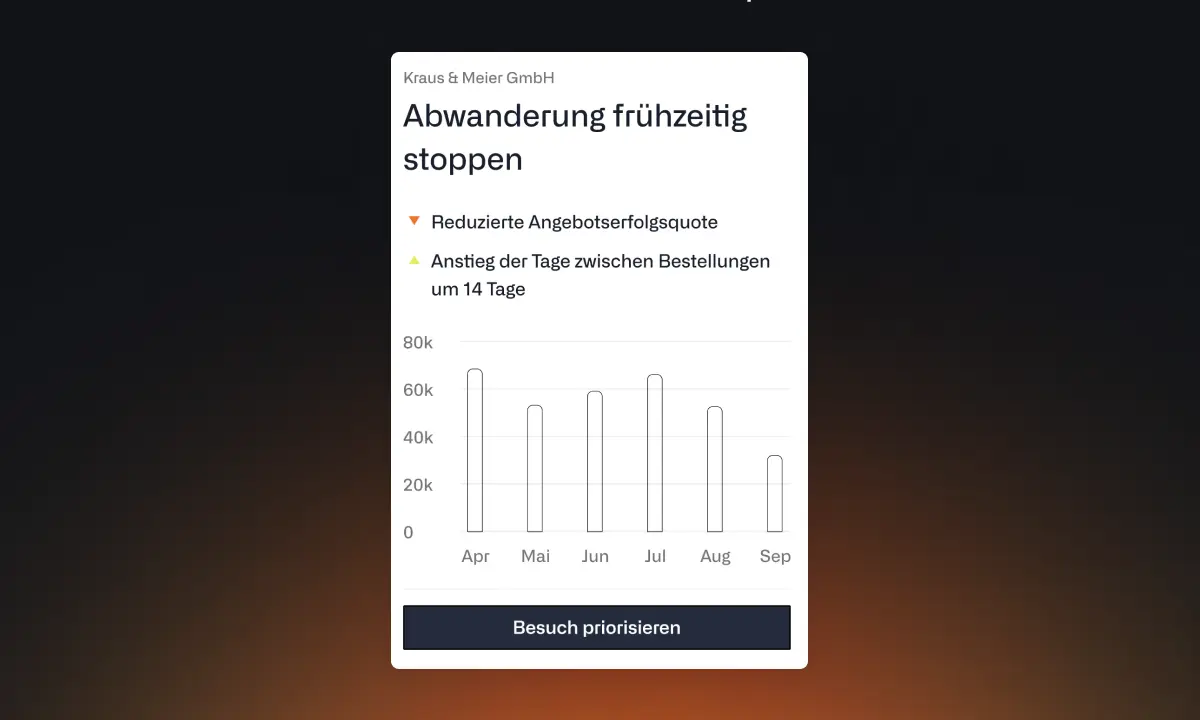
Acto is the sales AI for wholesale. Acto reads the ERP order data daily, compares each customer with their own rhythm and with similar customers, and shows field sales who is slipping and which product group is missing, with reasoning, in Outlook, in the CRM or in the app. Feedback from the visit, such as "company vacation", feeds into the next assessment.
"Every inside sales rep at Hitado uses acto daily as the backbone of their customer care. Each day they get 10 prioritized signals pointing to the most relevant customers to contact that day. That makes our outreach targeted and efficient - and we were able to reduce churn significantly." – Ilka Greco, Head of Inside Sales, Hitado (case study)
In pilot projects with a control group, revenue for Acto users rose by 11.2 percent at Schäfer Shop and by 5.4 percent at Hitado.
Which customers in your ERP data are quietly ordering less right now?
When an early-warning system won't help (yet)
An early-warning system adds little if your customer base is small enough that you know every customer personally. With 30 to 50 customers, an experienced rep usually spots a change without a score.
Without at least a year of reliable order history, you can't calculate a normal pattern, and the score produces nothing but noise. Purely project-based business without recurring orders has no baseline for a customer to deviate from. And if sales has no capacity for additional conversations, a list full of warnings only adds pressure.
FAQ
How quickly should I react to a churn signal?
Ideally within a week. The longer a missing order goes unnoticed, the more likely the customer has gotten used to another supplier.
Is Excel enough to start?
Yes, with three to five signals. Weekly upkeep only becomes a bottleneck once each field sales rep has several hundred customers and you carry thousands of items; at that point, a system that calculates the signals daily pays off.
What is the difference between churn prediction and a CRM forecast?
A CRM forecast is based on what sales has entered. Churn prediction analyzes actual order behavior from the ERP and flags deviations even if nobody has logged them in the CRM.
How do I know whether a signal was a false alarm?
From how the conversation goes. Record whether the signal reflected churn, a seasonal pause or a one-off effect, and use that to fine-tune the thresholds. That way the score gets more accurate every week.