Customer Analysis in Wholesale: Methods, Steps and an Example
Summary
- Customer analysis evaluates data on your existing customers so sales knows which accounts are worth the effort, which are drifting away and where untapped revenue sits.
- In wholesale, the most telling data source is the ERP, because it holds years of order history by customer, item and product group.
- According to Forrester, only 39% of data and analytics decision-makers in retail and wholesale use churn analysis, even though the signals of silent churn are already sitting in the order data.
- Rate customers by potential and current buying signals, not just last year's revenue. Sorting them into revenue classes A, B and C (ABC analysis) overlooks growing C customers, the accounts in the lowest-revenue class.
| Method | Answers the question |
|---|---|
| Customer segmentation | Which customers buy in similar ways? |
| Customer value / Customer Lifetime Value | Which customers pay off in the long run? |
| ABC analysis | Who brings in the most revenue today? |
| Behavior and churn analysis | Who is ordering less than usual? |
| Potential or white-spot analysis | What does a customer not yet buy from us? |
Which of your customers are genuinely worth it, which are slipping right now, and where is revenue that nobody is going after? Most of the answers are already in your order data. Hardly anyone analyzes it, though: just 39% of data and analytics decision-makers in retail and wholesale use churn analysis.
So whether your sales team calls on the right customers next week comes down to one question:
Which method turns this data into a list that field and inside sales will actually work from?
What is customer analysis?
Customer analysis is the systematic evaluation of data about your customers to understand who buys, what they buy, how much they're worth and how their behavior is changing. It has three goals: reduce wasted sales effort, grow revenue with existing customers and retain them.
Several terms get used interchangeably but mean different things:
- Customer segmentation: a method within customer analysis that groups customers with similar characteristics.
- ABC analysis: a customer rating method that splits customers into three classes by their share of revenue.
- Customer analytics: usually the ongoing, software-supported analysis of customer data, i.e. customer analysis as a continuous process.
- Market and target-group analysis: looks at potential customers, whereas customer analysis looks at the ones you already have.
A useful framework is the split into four types of analytics:
- Descriptive: what happened
- Diagnostic: why it happened
- Predictive: what will happen
- Prescriptive: what we should do
In our experience, most sales organizations never get past the first.
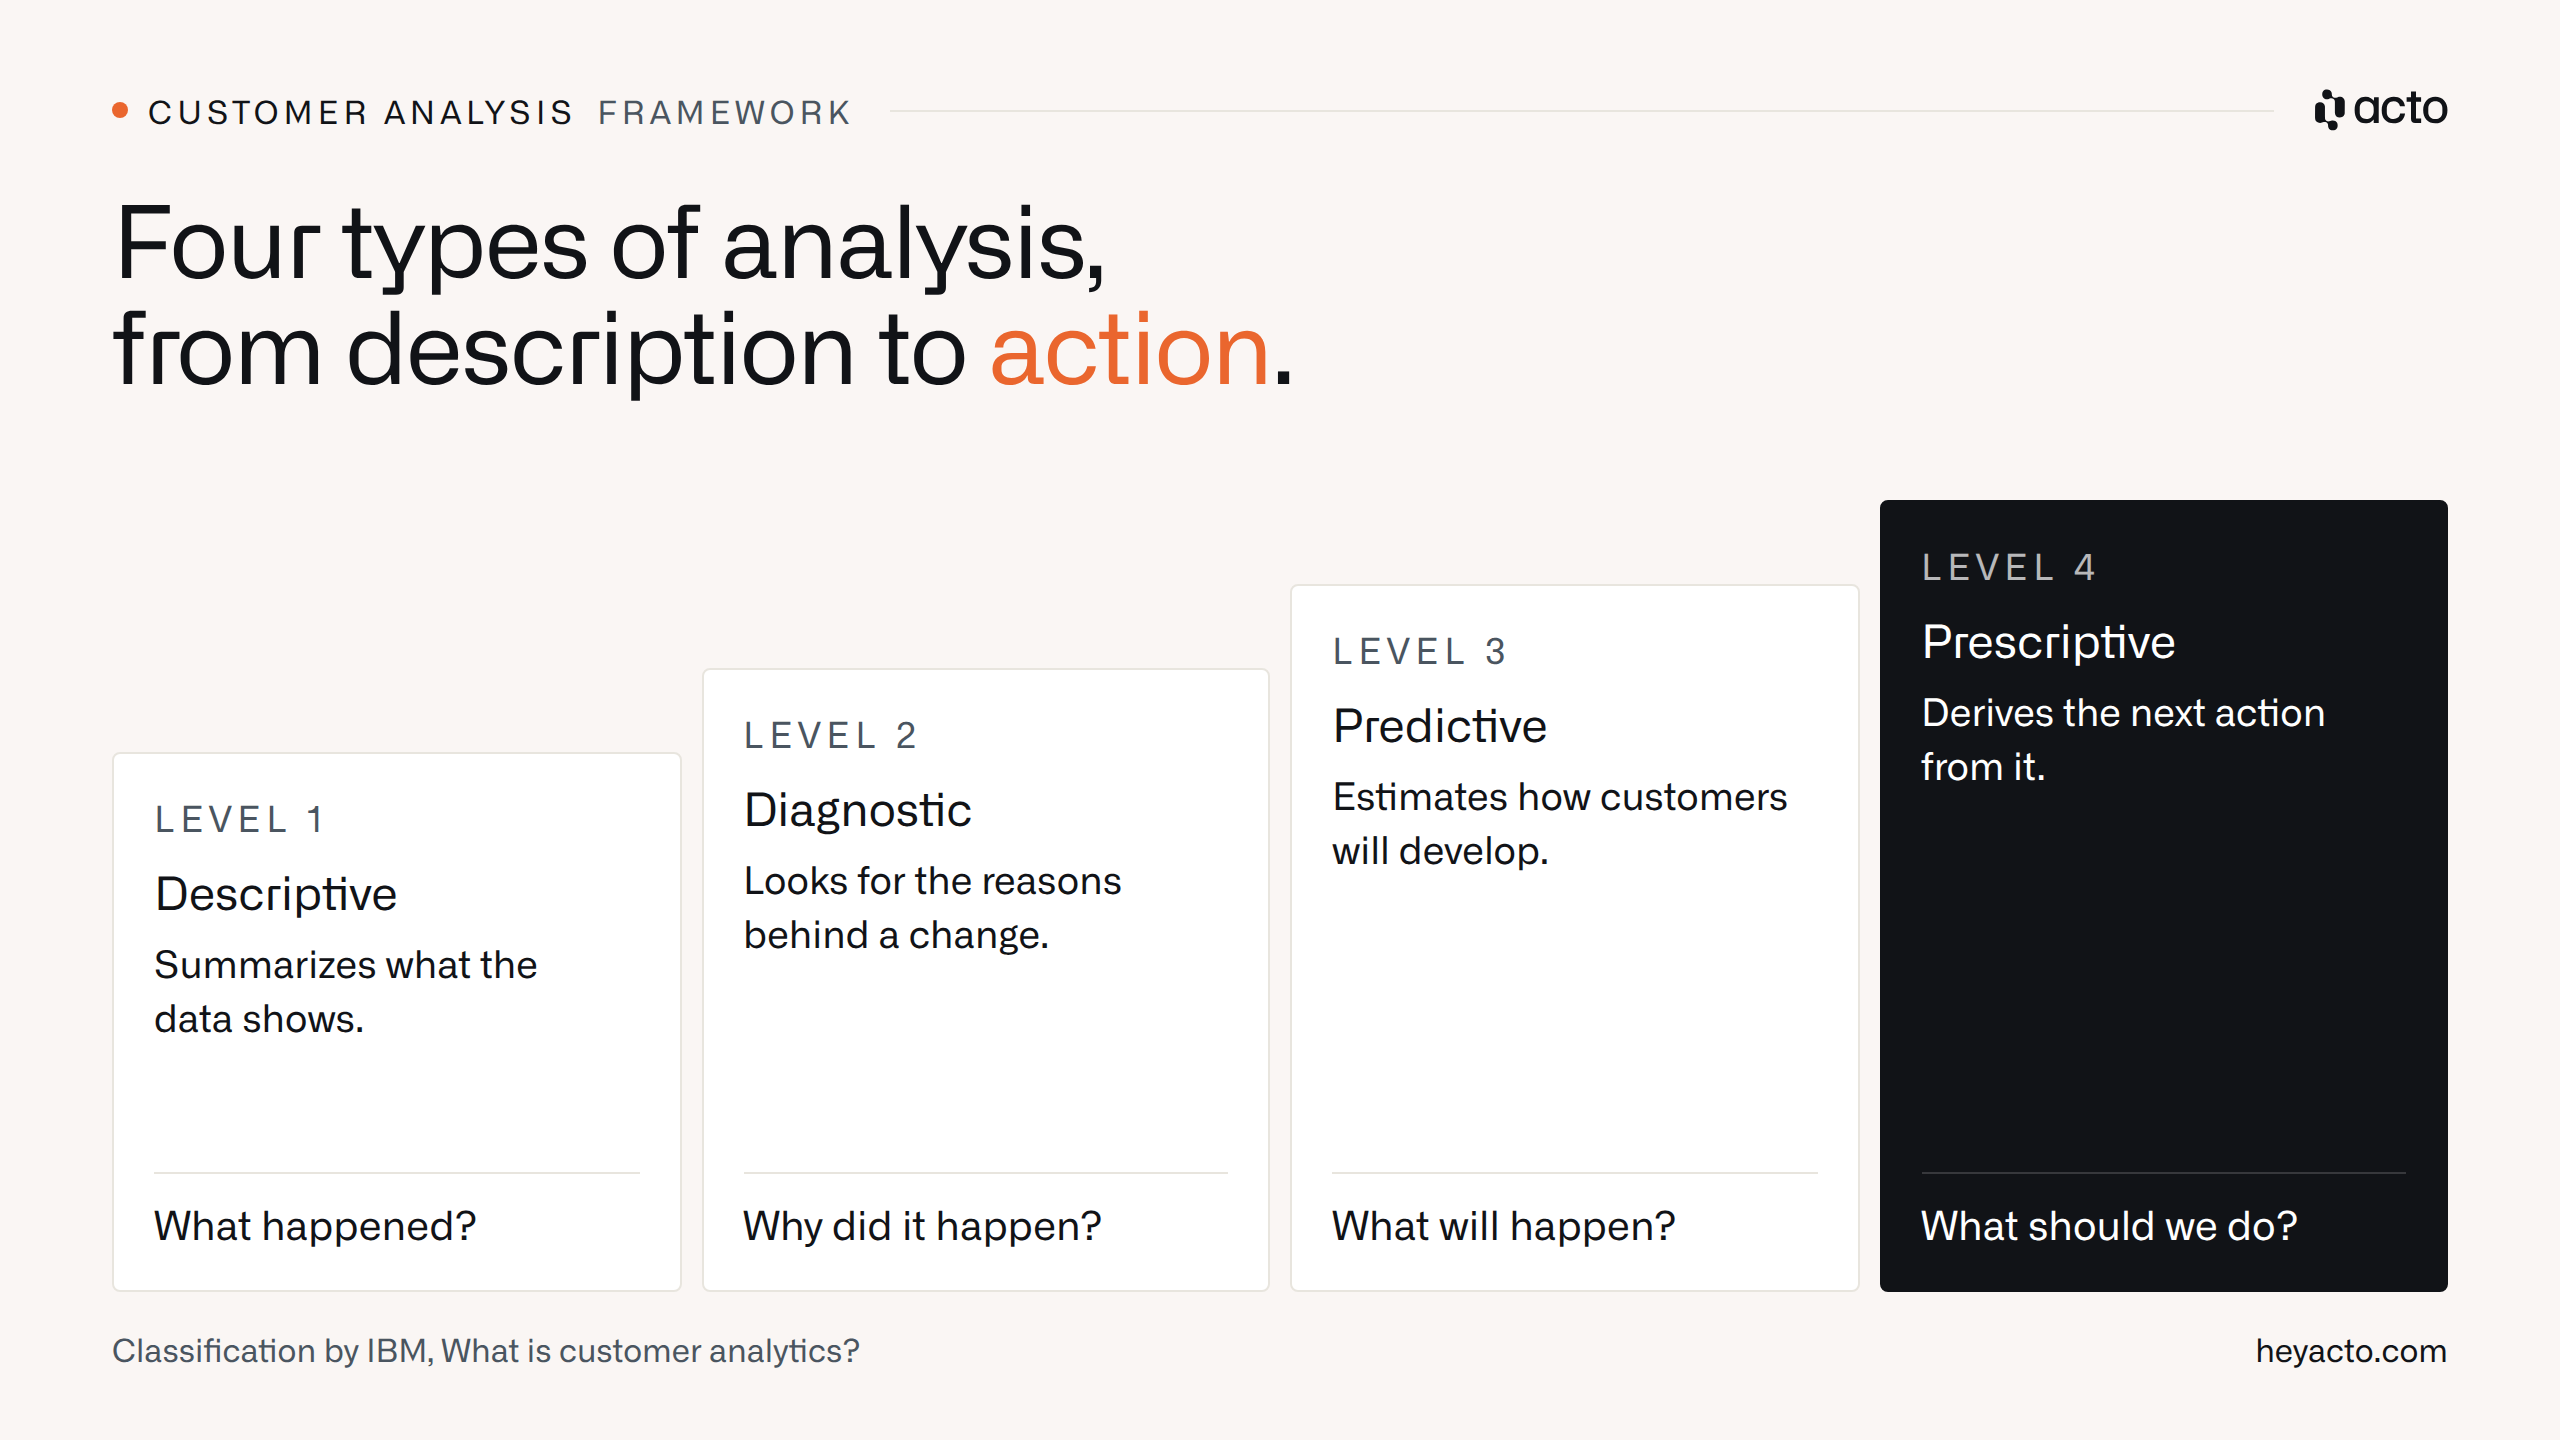
The four types of analytics at a glance, from descriptive to prescriptive.
What customer analysis methods are there?
Each common method shows a different slice:
- Segmentation shows structure.
- Customer value and ABC analysis show value.
- Behavior analysis shows change.
- Potential analysis shows what's missing.
No single method is enough, and which one you need depends on the question you want answered.
| Method | Question it answers | Data basis | Limitation |
|---|---|---|---|
| Customer segmentation | Which customers are comparable? | Master data, buying behavior | Says nothing about the individual customer |
| Customer value / Customer Lifetime Value (CLV) | Which customers pay off over the years? | Contribution margin, length of relationship | Requires an assumption about future duration |
| ABC analysis | Who brings in the most revenue? | Revenue per customer | Only looks backward |
| Behavior and churn analysis | Who is deviating from their pattern? | Order history, intervals, basket | Needs enough orders to establish the usual pattern |
| Satisfaction analysis | How satisfied are customers? | Surveys, Net Promoter Score (NPS) | Lags behind behavior |
| Potential or white-spot analysis | Which product groups is the customer missing? | Range per customer compared with similar customers | Requires clean segmentation |
How does customer segmentation group your customers?
Customer segmentation groups customers with similar characteristics so you can compare them and target them deliberately. One-dimensional means by a single attribute, such as industry or region. Multi-dimensional means by several attributes at once.
In B2B, we recommend grouping mainly by buying behavior:
- Purchase frequency
- Product range groups
- Revenue class
- Industry as an additional attribute
Only once you know which customers buy alike can you later spot that one of them isn't buying a product group all the others do.
How do you calculate customer value and Customer Lifetime Value?
Customer Lifetime Value (CLV) is the expected value a customer will bring over the remaining life of the business relationship. In its simplest form: annual contribution margin × expected length of the relationship in years.
Example: an electrical contractor generates €12,000 in contribution margin a year, and you expect them to keep buying from you for eight more years. Their customer value is then €96,000, calculated without discounting.
With existing customers, contribution margin tells you more than revenue, because two customers with the same revenue can be on very different terms. Look only at revenue and you can easily mistake the customer with the deepest discounts for the most valuable one.
What is ABC analysis of customers?
ABC analysis splits your customers into three classes by their share of total revenue: A customers bring in the largest share, C customers the smallest. It's based on the Pareto principle and is one of the simplest methods you can run from an Excel export.
Here's how:
- Sort: rank all customers by revenue over the last twelve months, highest first.
- Accumulate: calculate each customer's share of total revenue and the running cumulative share.
- Set cut-offs: as a rule of thumb, class A is the customers who together account for around 80% of revenue, class B the next 15–20%, and the rest is class C.
Example with ten customers and €1,000,000 in total revenue:
| Customer | Revenue | Share | Cumulative | Class |
|---|---|---|---|---|
| Customer 1 | €320,000 | 32% | 32% | A |
| Customer 2 | €250,000 | 25% | 57% | A |
| Customer 3 | €180,000 | 18% | 75% | A |
| Customer 4 | €90,000 | 9% | 84% | B |
| Customer 5 | €60,000 | 6% | 90% | B |
| Customer 6 | €40,000 | 4% | 94% | B |
| Customer 7 | €25,000 | 2.5% | 96.5% | C |
| Customer 8 | €15,000 | 1.5% | 98% | C |
| Customer 9 | €12,000 | 1.2% | 99.2% | C |
| Customer 10 | €8,000 | 0.8% | 100% | C |
The result: three A customers bring in 75% of revenue, three B customers 19% and four C customers just 6% between them.
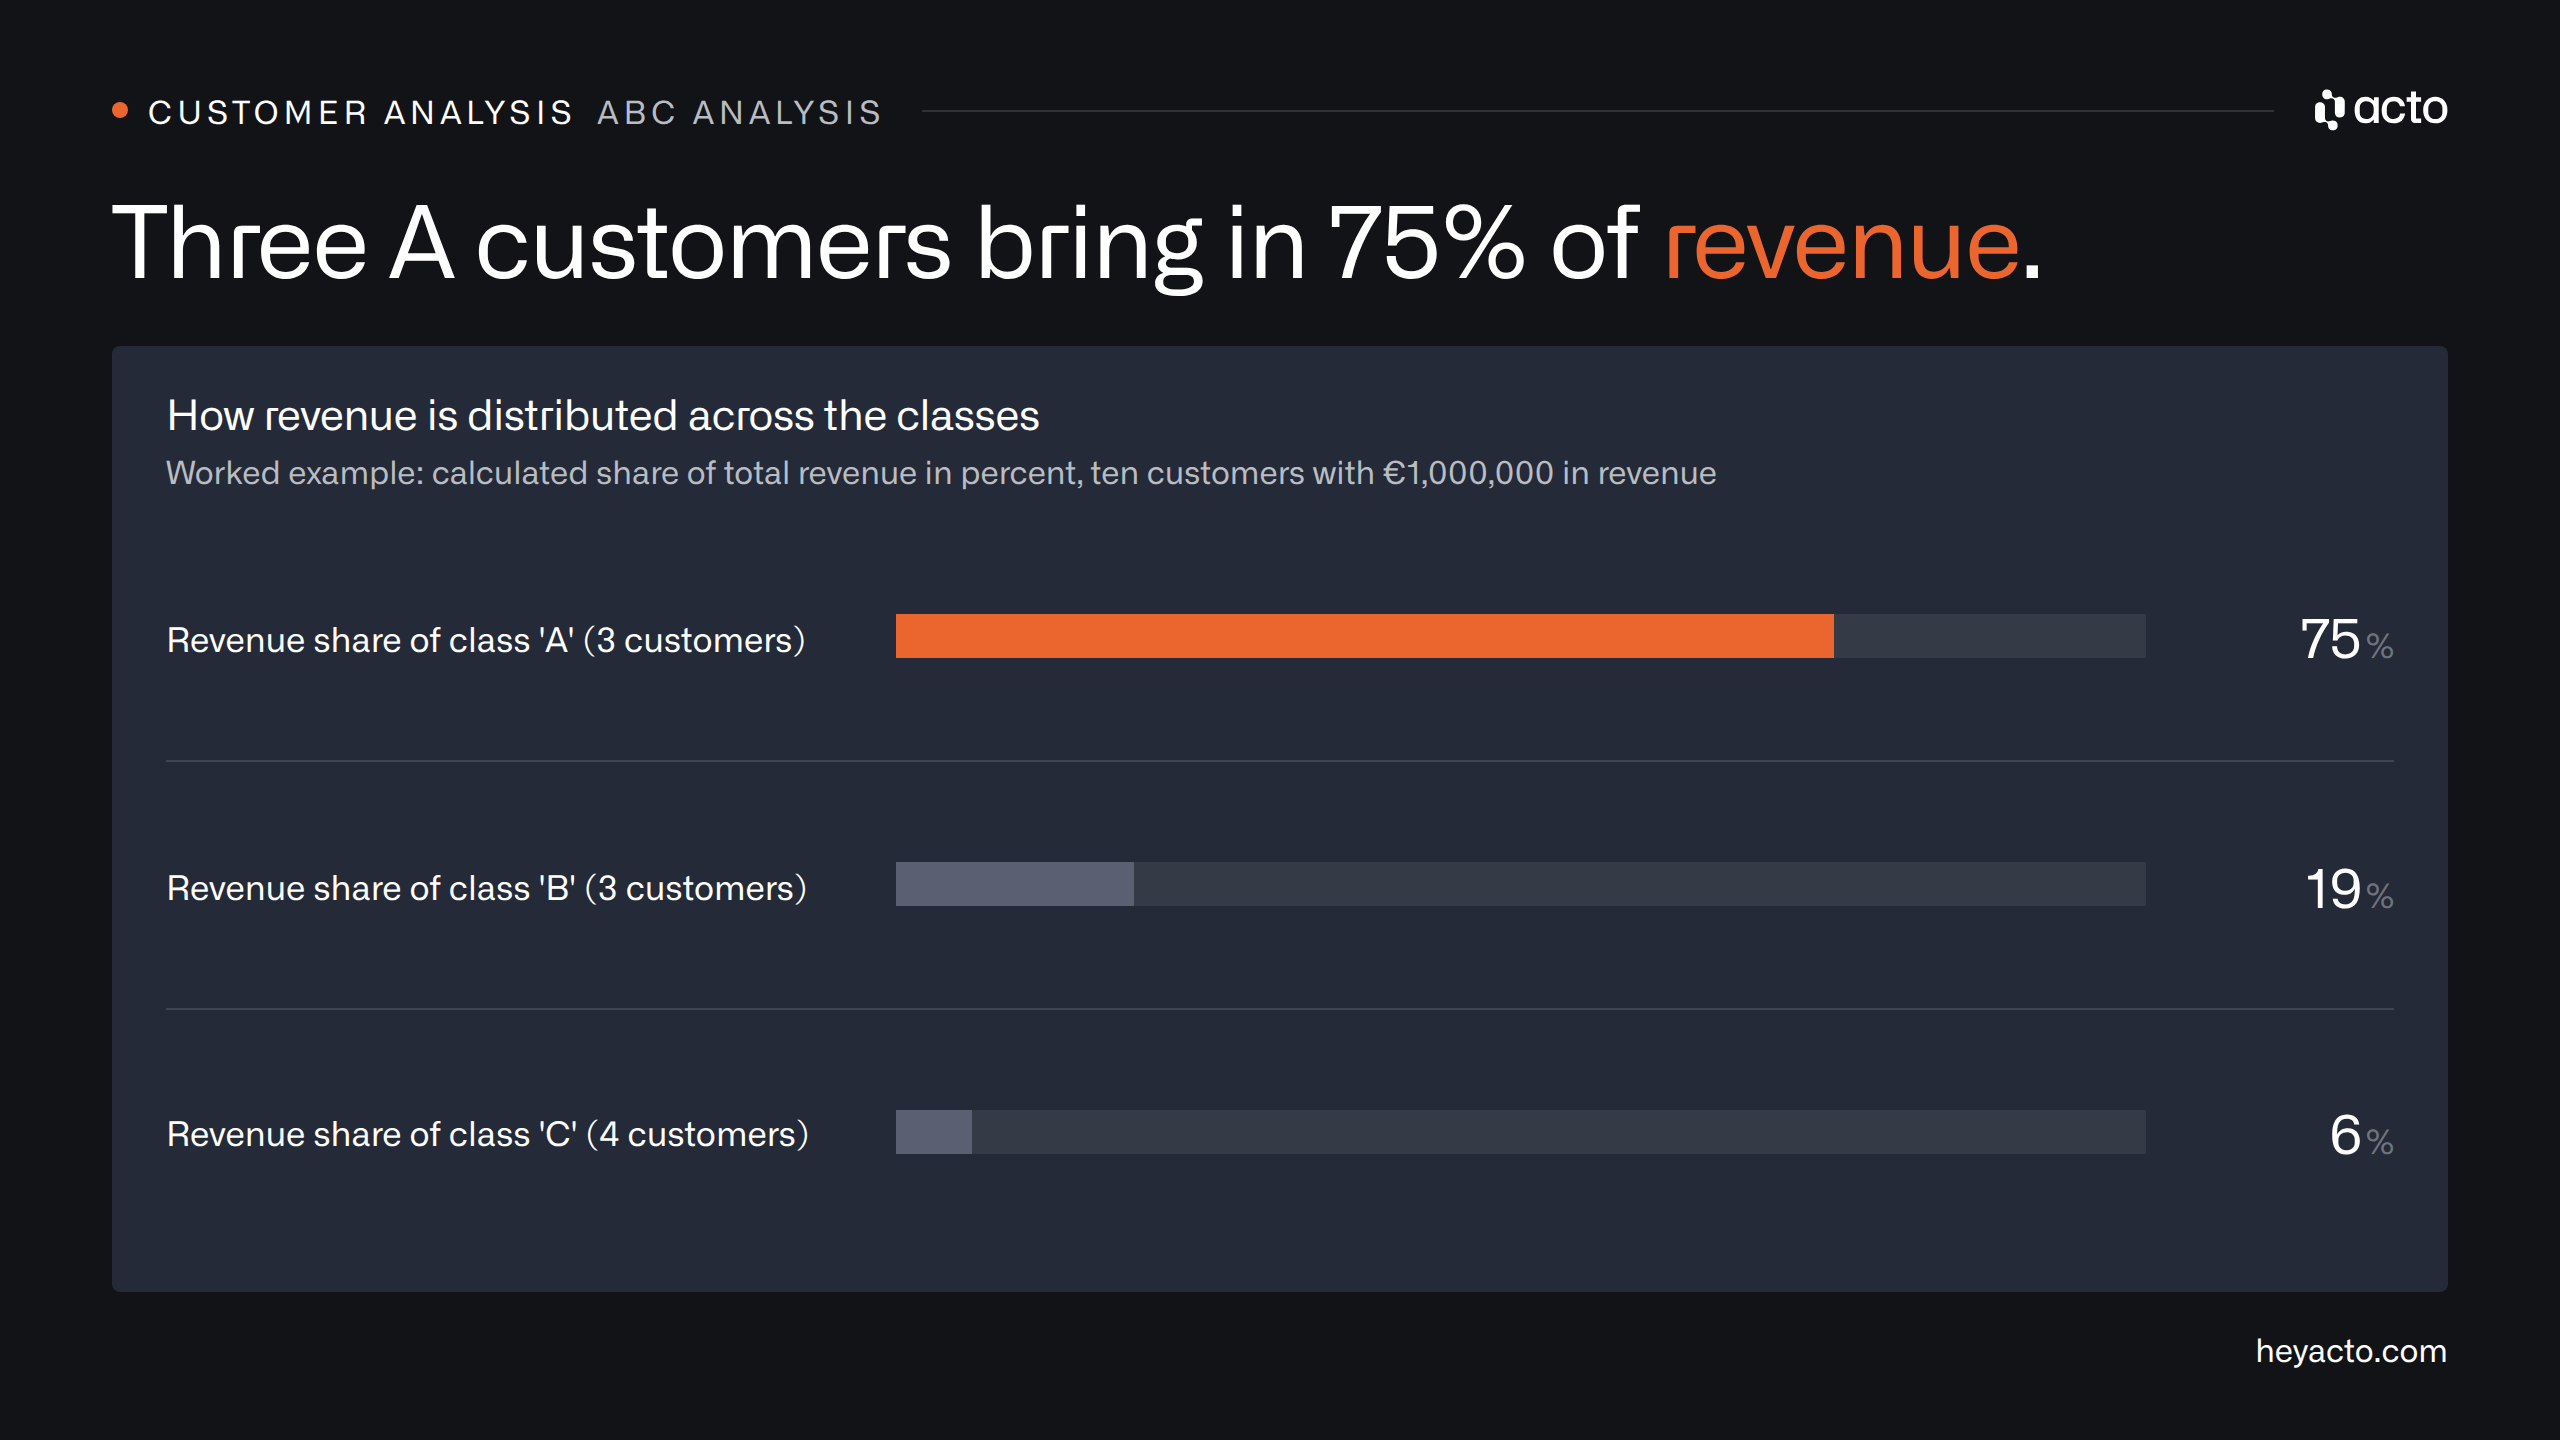
Three of the ten example customers bring in 75% of revenue, while the four C customers together bring in just 6%.
That's a workable starting point. Why ABC analysis alone falls short in wholesale is covered in the section on C customers below.
How do behavior and satisfaction analyses show that a customer is leaving?
Behavior and satisfaction analyses are two routes to spotting churn: behavior analysis measures what the customer does, satisfaction analysis asks how they feel about it. For buying behavior, you look at order frequency, basket size and the gap between orders. Net Promoter Score (NPS) surveys measure willingness to recommend.
In wholesale, behavior is the earlier signal. Customers rarely leave with a bang; they just order less, and the order history shows it before a customer ticks anything critical in a survey. The exact signals are covered in the section on ERP data.
How do you run a customer analysis step by step?
Customer analysis follows four steps, and to start with an ERP export into Excel is enough. You don't need data scientists or new software.
- Define the question: one question that triggers a decision
- Combine the data: order history from the ERP and master data, with the CRM as a supplement
- Analyze: using the method that answers your question
- Define the action: with an owner and a date
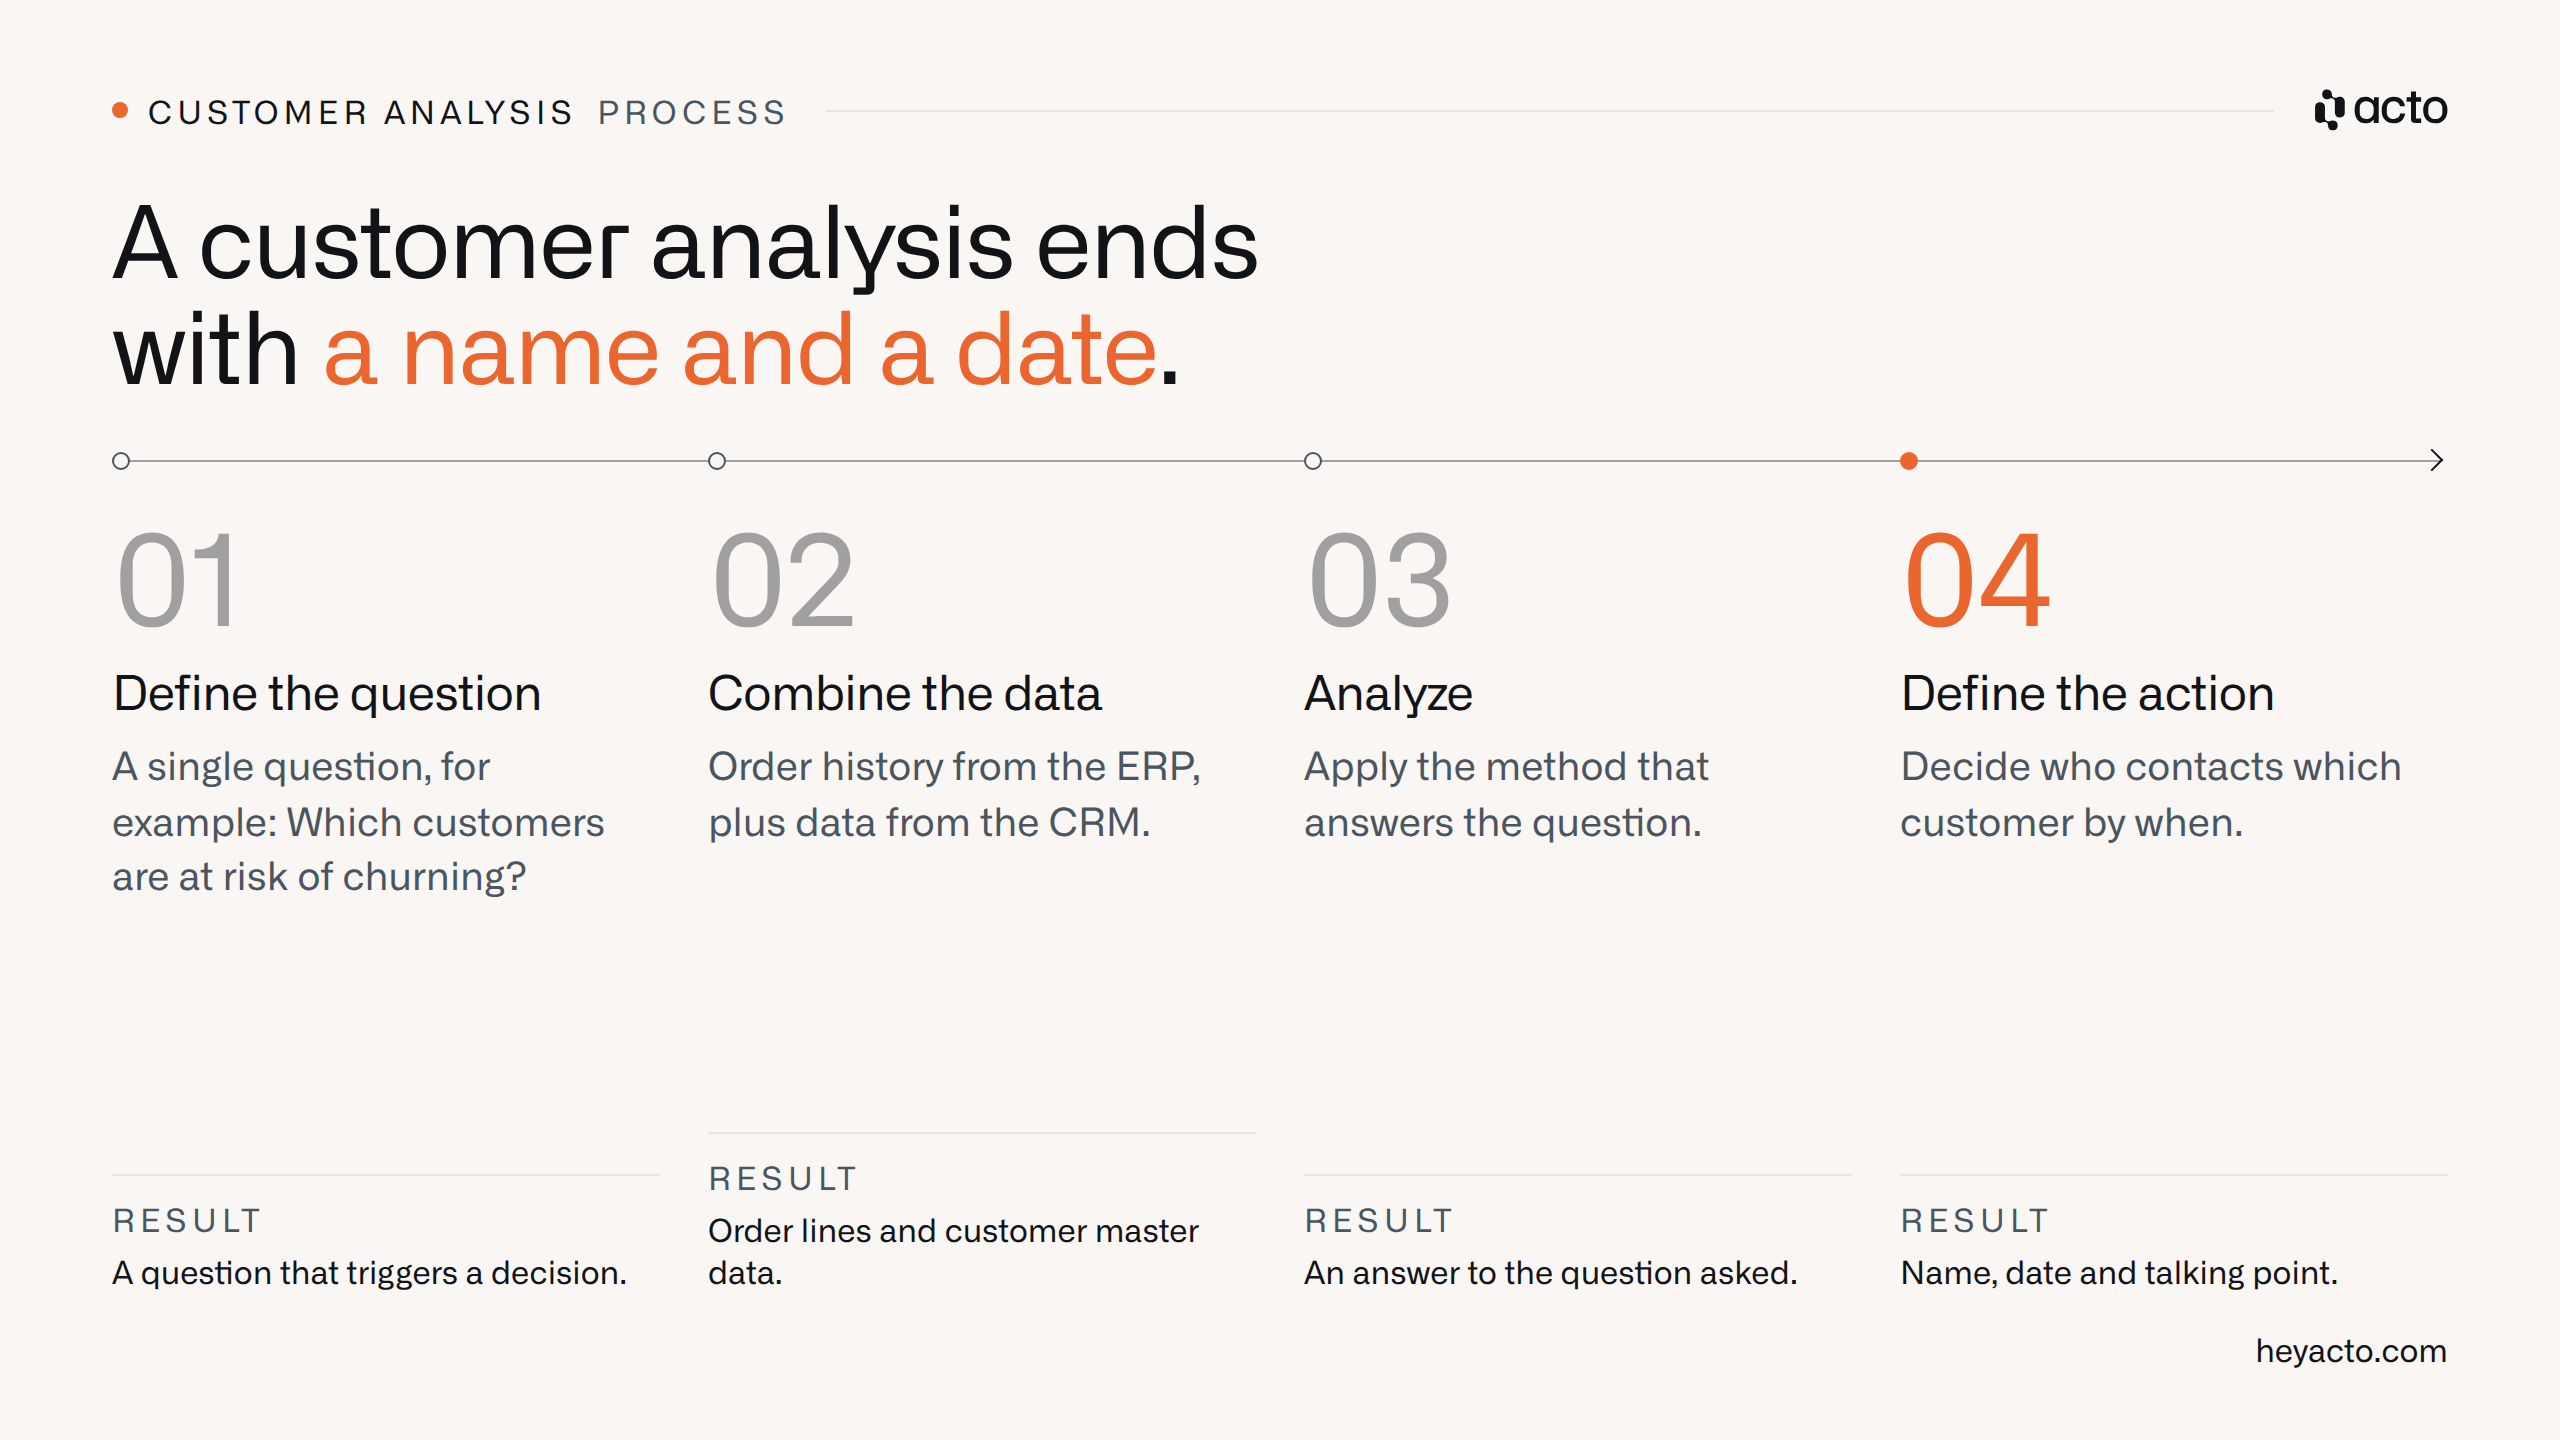
A customer analysis is only finished when it ends with a name and a date.
Step 1: Define the question
Start with a single question that triggers a decision, such as "Which customers are at risk of churning?" or "Which B customers aren't buying a product group that comparable customers buy?" An analysis without a question ends up as a report nobody reads.
Step 2: Combine the data
The CRM only contains what someone entered, and in field sales that's often patchy. The ERP, by contrast, holds years of order history, product range, margins and terms. For most questions, order lines with customer number, item, product group, quantity, revenue and date are enough, plus customer master data.
Step 3: Analyze
Apply the method that answers your question:
- Revenue distribution: an ABC classification
- Churn: a comparison of order intervals
- Range gaps: a product-group comparison within a segment
Pivot tables in Excel will do the job, as long as you're handling a manageable number of customers once a quarter.
Step 4: Define the action
Every finding gets a name, a date and a talking point: who contacts which customer, by when, and about what. Without this step, every customer analysis stays a statistic.
What's different about customer analysis in wholesale?
In wholesale, revenue comes from the existing customer base, and the analysis has to cover hundreds of customers per sales rep across tens of thousands of items. Nobody can do that in their head. That makes the ERP order history the most important data source, and field and inside sales are the ones who work with the results.
From here on, we're talking about distributors and manufacturers with their own direct sales. In our study "Wholesale Sales 2026", based on data from 106 companies, a field sales rep looks after 247 customers on average, with a median of 175. At those numbers, nobody can keep track of where cross-selling potential or churn risk is emerging among B and C customers.
Four things set customer analysis in wholesale apart from textbook examples:
- Revenue comes from the existing base: in wholesale, new customer acquisition mostly offsets businesses that close; the bulk of revenue comes from customers you already have.
- Order history, not surveys: customers order repeatedly, so their buying behavior reveals any change sooner than a survey ever could.
- Range breadth: with thousands of items, a customer can move an entire product group to a competitor without total revenue raising a flag.
- Sales as the user: the result has to reach field reps in their cars and inside sales on the phone, where customer conversations actually happen.
On top of that, CRMs are built for new-business pipelines: interest, qualification, quote, close. Hardly any of them capture order rhythm, seasonality or range penetration. That's why revenue drops and lost product groups often go unnoticed for months, long after the customer has made their decision.
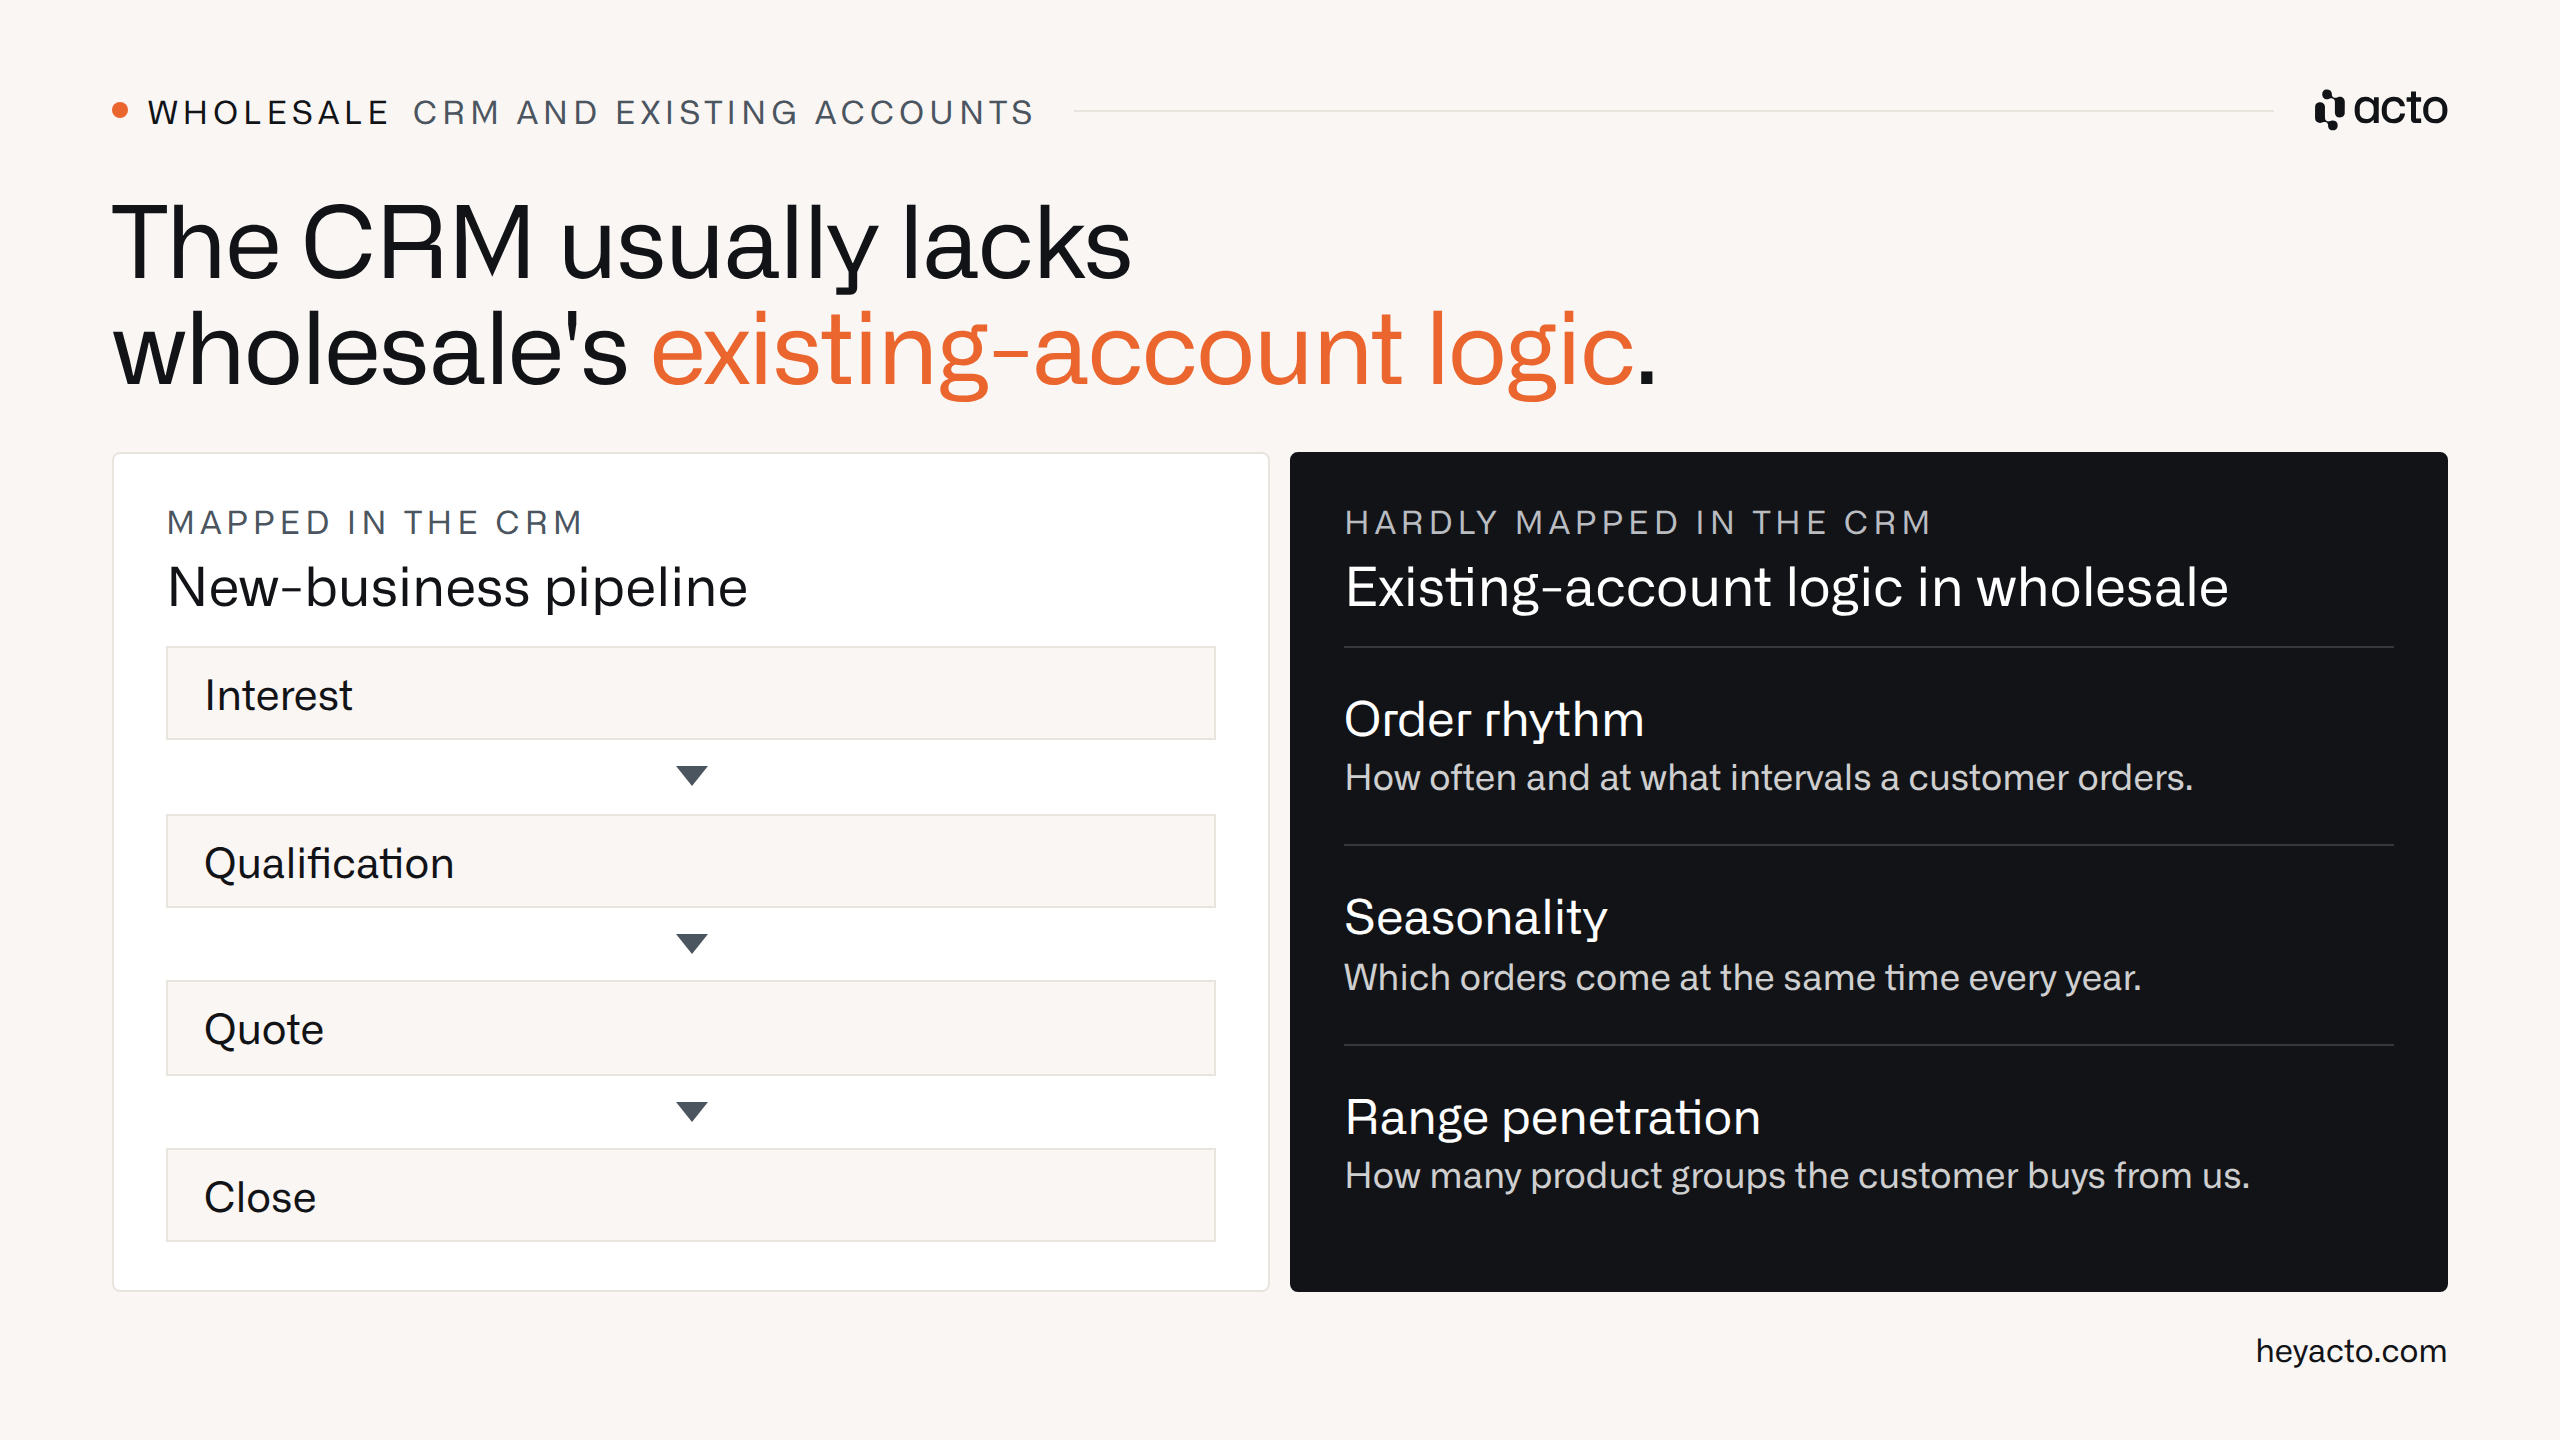
A CRM maps the new-business pipeline; in wholesale, what counts is order rhythm, seasonality and range penetration.
"We have 800 item groups. […] a manual, laborious process […] That just doesn't work in practice […] the account manager has 50 customers."
– Head of IT, automotive parts distributor
It isn't the field team's fault. They simply lack the time and the system to track hundreds of customers across hundreds of product groups.

Why does a C customer stay a C customer in ABC analysis?
A C customer stays a C customer because ABC analysis sorts by yesterday's revenue, and sales treats them accordingly: no visits, no offers, contact only when they order or complain. If that customer grows, they grow with a competitor.
A sales director at a plumbing, heating and air-conditioning (HVAC) distributor told me his B and C customers don't feel properly looked after and his team only reacts when something goes wrong. With A customers, everything runs smoothly: regular visits, proactive offers, strategy meetings. Everyone else gets a visit when there's time left over.
Picture a small installation business that has been ordering small parts from you for two years. It takes over a second company, hires fitters and suddenly needs heating equipment and bathroom ceramics in entirely different volumes. In your ABC list it's still class C, so nobody goes out there. It covers the new demand with whichever distributor's rep shows up first.
The same gap shows up with churn. If only 39% of analytics decision-makers in retail and wholesale systematically look for customers who are leaving, almost nobody is looking for the ones who are growing. Even encyclopedia entries on the method describe ABC analysis as a limited, highly simplified picture.
In conversations with sales directors, I sometimes hear: "We know our customers really well." But a person can only truly know around 30 to 50 customers; for the rest of the territory, gut feeling decides.
An ABC list sorts by yesterday's revenue. To plan next week, sales needs tomorrow's potential.
ABC analysis remains a good starting point because it shows where the money comes from today. As a management tool for visits, it isn't enough. We recommend rating every customer on three additional criteria:
- Range breadth compared with similar customers: how many product groups do they buy, and how many do comparable customers in their segment buy?
- Trend in order frequency: are they ordering more or less often than in previous periods?
- Share of total demand: how much of their demand do they cover with you, i.e. your share of wallet?

The ABC class shows yesterday's revenue; range breadth, order frequency and share of total demand show the potential.
How to build a matrix of current revenue and potential from this is explained in our article on potential-based selling.
What buying signals are hidden in your ERP data?
Your ERP data shows, for every customer, whether they're currently deviating from their usual order pattern, downward or upward. That means distributors are sitting on better buying signals than any software company paying good money for website visits and click data, yet they barely use them.
When I ask sales directors which of their customers is genuinely overdue on a reorder right now, the room often goes quiet. The answer is in the ERP; nobody just has time to look for it day to day.
"If nobody actively checked which customer's revenue is dropping, nobody would follow up on it either."
– Sales rep, mid-sized spare parts distributor, initial meeting
These are the signals worth watching in wholesale:
- Overdue reorder: a customer still hasn't reordered an item well past their usual rhythm, say after seven weeks instead of the usual four.
- Product group dropping off: total revenue is stable, but a product group the customer bought regularly disappears.
- Only small parts left: the customer keeps ordering, but only consumables; the big-ticket lines have stopped.
- Missing seasonal order: a customer who orders every spring is absent in exactly that window.
- Complementary product never bought: the customer buys product A but never product B, which similar customers almost always buy with it.
- Sudden jump in orders: a customer orders significantly more than in the previous quarter, a sign of growth and new demand.
For this, we compare a customer's revenue and orders over one, three and six months and against the previous quarter. We typically look at short-term changes within the last six months, because older swings say nothing useful for planning next week. You'll find more examples in our article on churn signals in wholesale.
How do you spot churn before total revenue drops?
You spot churn early by looking at deviations from each customer's normal pattern, because customers leave one product group at a time. Total revenue looks healthy for a long time, since the standard items keep selling. That's exactly what silent churn in distribution is: there's no clear moment when a customer stops being a customer.
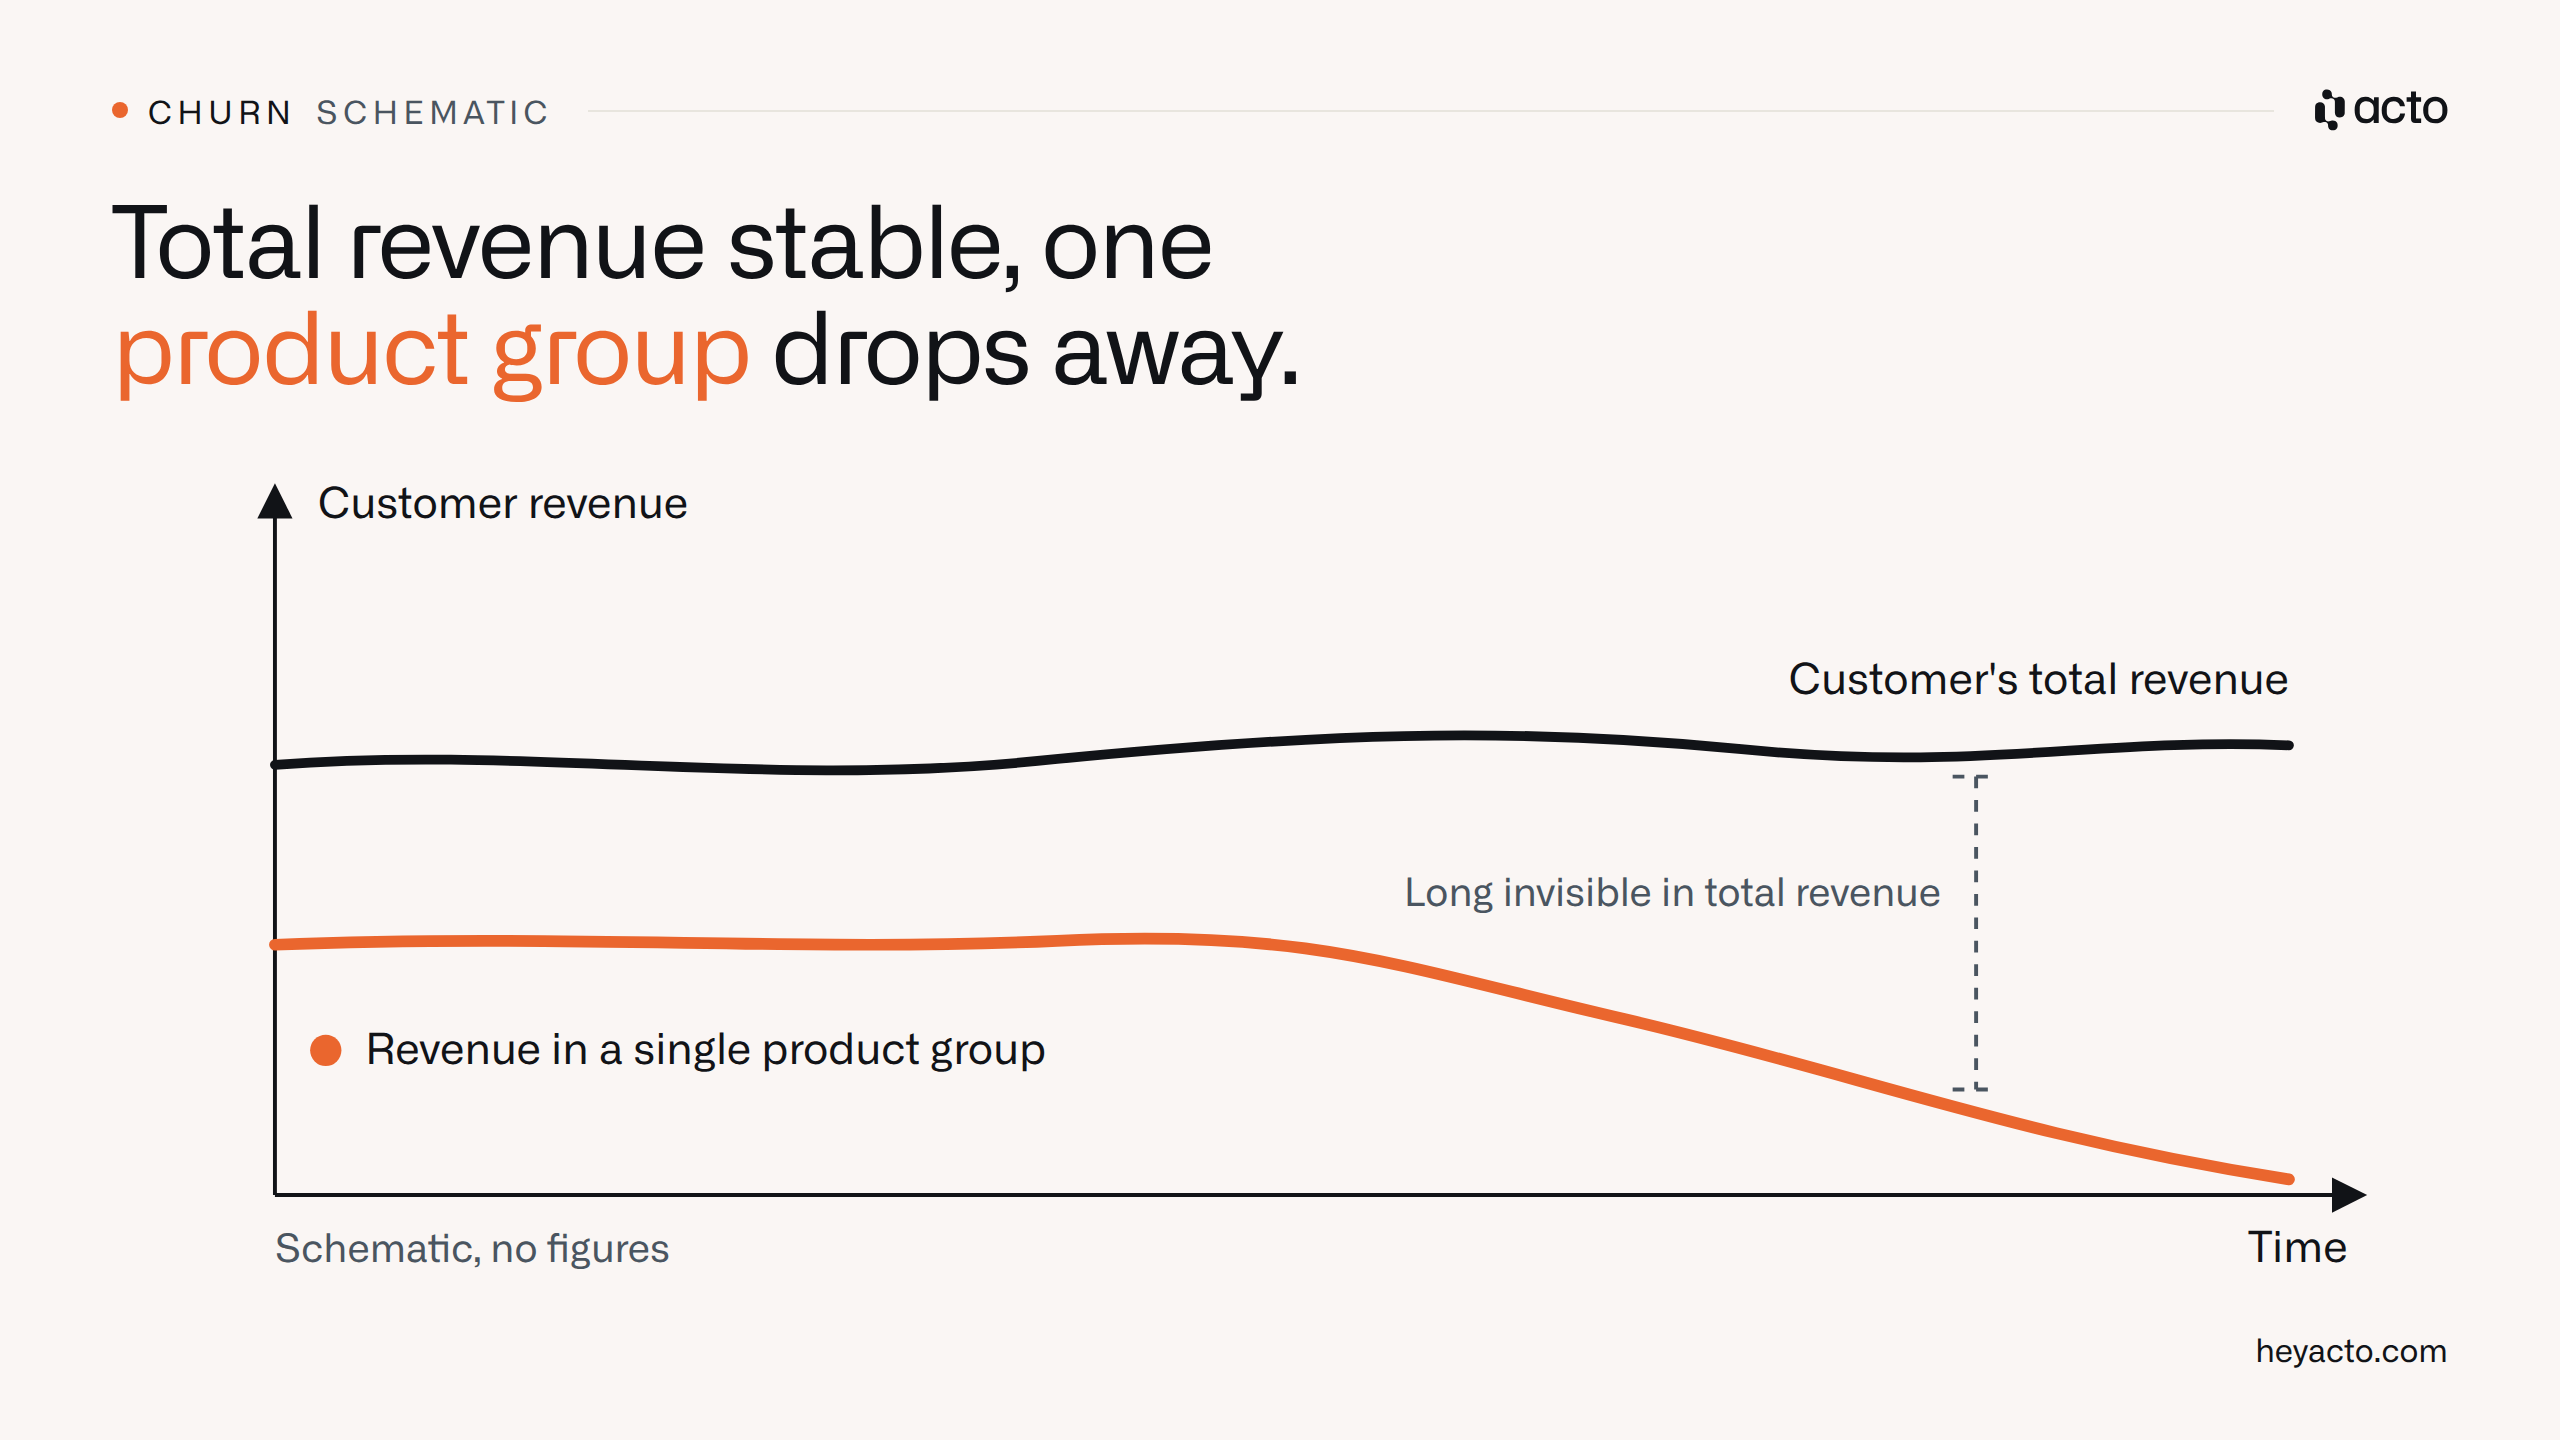
Total revenue looks healthy for a long time while a single product group is already falling away.
That's why a fixed rule like "three months without an order" doesn't fit any customer properly. We compare each customer against their own order history and against similar customers:
- Repurchase interval: the days between two of the customer's orders.
- Normal order pattern: the usual order rhythm, including seasonal variation.
- Peer group: customers with similar buying behavior.
- Deviation: changes against their own order pattern and the behavior of similar customers.
A deviation from the usual order pattern points to a possible churn risk. A customer who orders weekly, for example, stands out after just a few missed orders; one on a quarterly rhythm only much later, and both rightly so. It's also worth comparing against similar customers who showed the same pattern in the past and then left.
Order data alone can be misleading, though, because some things live only in the sales rep's head:
- Who makes the decisions at the customer
- What they use the material for
- What's currently changing in their business
Only that context turns a deviation into a signal.
With and without context: Siebert hasn't ordered anything in three weeks. Without context, that means: churn risk, call now. With the visit report alongside it, it means: company holiday until 15 September, no alarm, reminder on 16 September.
This approach has one limitation: in project business without repeat orders, there are no buying signals, and order history is of little help.
How do you find cross-selling potential and range gaps?
You find cross-selling potential by comparing a customer with similar customers in their segment and looking for product groups the peer group buys that this customer doesn't. A roofer who buys tiles and roofing underlay from you but never roof windows, while almost every comparable roofer does, has a range gap.
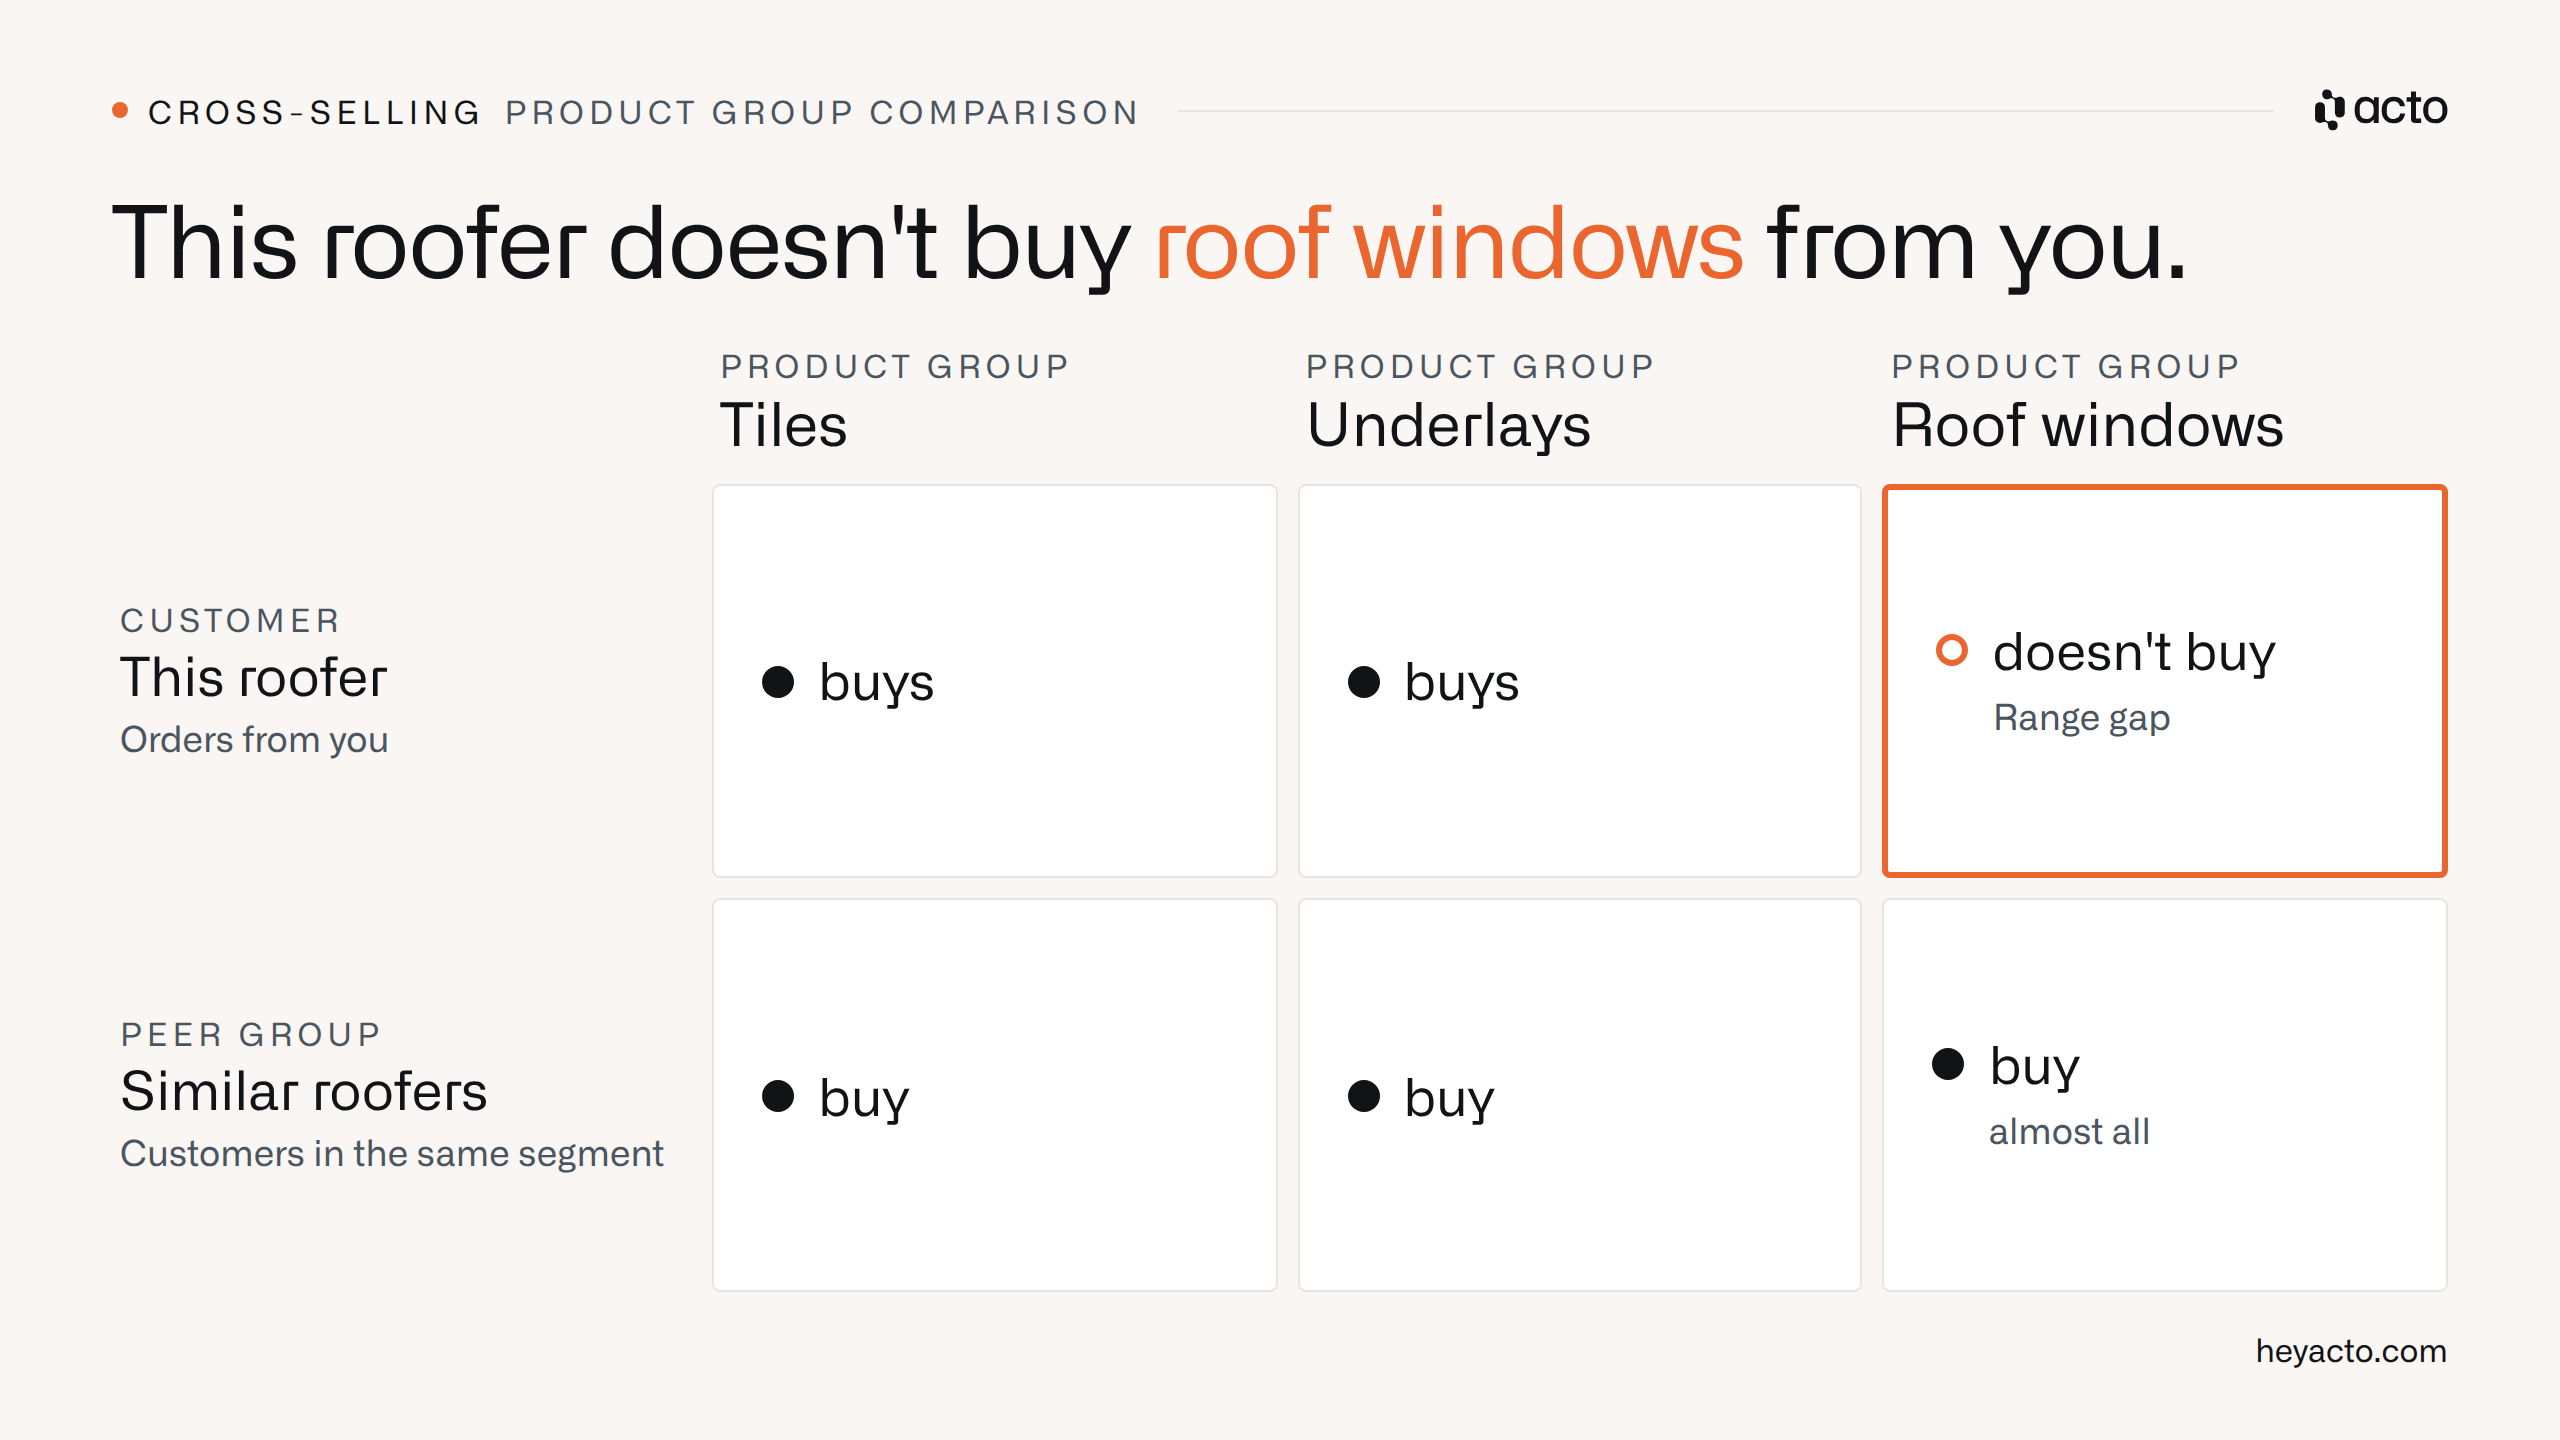
A range gap shows up in comparison: almost all comparable roofers buy roof windows, this customer doesn't.
B2B customers rarely buy just one product. They have upstream and downstream needs, and many simply don't know which other product groups their supplier carries. If you don't know where those gaps are, you leave revenue on the table on a large scale. Our article on white-spot analysis explains how to track them down systematically.

Example: What does the analysis look like for five customers of a building materials distributor?
Rate five customers of a building materials distributor on signals and potential as well, and the week's priority list looks very different from the ABC ranking: one A customer drops off this week, and a B and a C customer are added.
Picture a regional building materials distributor whose field rep is planning next week on Friday. Comparable customers in each segment buy seven of nine product groups on average.
| Customer | 12-month revenue | ABC class | Product groups (peer group: 7 of 9) | Order rhythm | Signal |
|---|---|---|---|---|---|
| Dachdeckerei Krause | €410,000 | A | 8 of 9 | every 2 weeks, stable | none |
| Bauunternehmen Hahn | €360,000 | A | 7 of 9 | every 2 weeks, stable | insulation dropping off |
| Fliesenleger Brandt | €95,000 | B | 6 of 9 | tile adhesive every 4 weeks | tile adhesive reorder overdue |
| Zimmerei Lindner | €28,000 | C | 3 of 9 | up from monthly to every 2 weeks | large range gap, growth |
| Gartenbau Vogt | €22,000 | C | 5 of 9 | no order for 3 weeks | company holiday per visit report |
Under pure ABC logic, the rep visits Krause and Hahn this week. With signals and potential factored in, the order looks like this:
| Priority | Customer | Channel | Talking point |
|---|---|---|---|
| 1 | Bauunternehmen Hahn | Field sales visit | Insulation: usually €8,000 a quarter, recently €1,500 |
| 2 | Fliesenleger Brandt | Inside sales call | overdue tile adhesive reorder |
| 3 | Zimmerei Lindner | Field sales visit | missing product groups such as roof windows and insulation |
| not this week | Dachdeckerei Krause | regular contact | nothing unusual |
| not this week | Gartenbau Vogt | reminder after the holiday | no alarm |
Run the numbers and the difference becomes tangible. At Hahn, €6,500 in insulation revenue is missing each quarter (€8,000 minus €1,500), or €26,000 a year, that will go to a competitor without a targeted conversation. At Lindner, comparable carpentry firms spend an assumed €40,000 a year combined in the six product groups he doesn't buy from you.
Together, €66,000 in annual revenue is at stake with these two customers, and the ABC list would have put only one of them on the schedule, without the right topic. The visit to Krause would have been a friendly appointment that changed nothing.
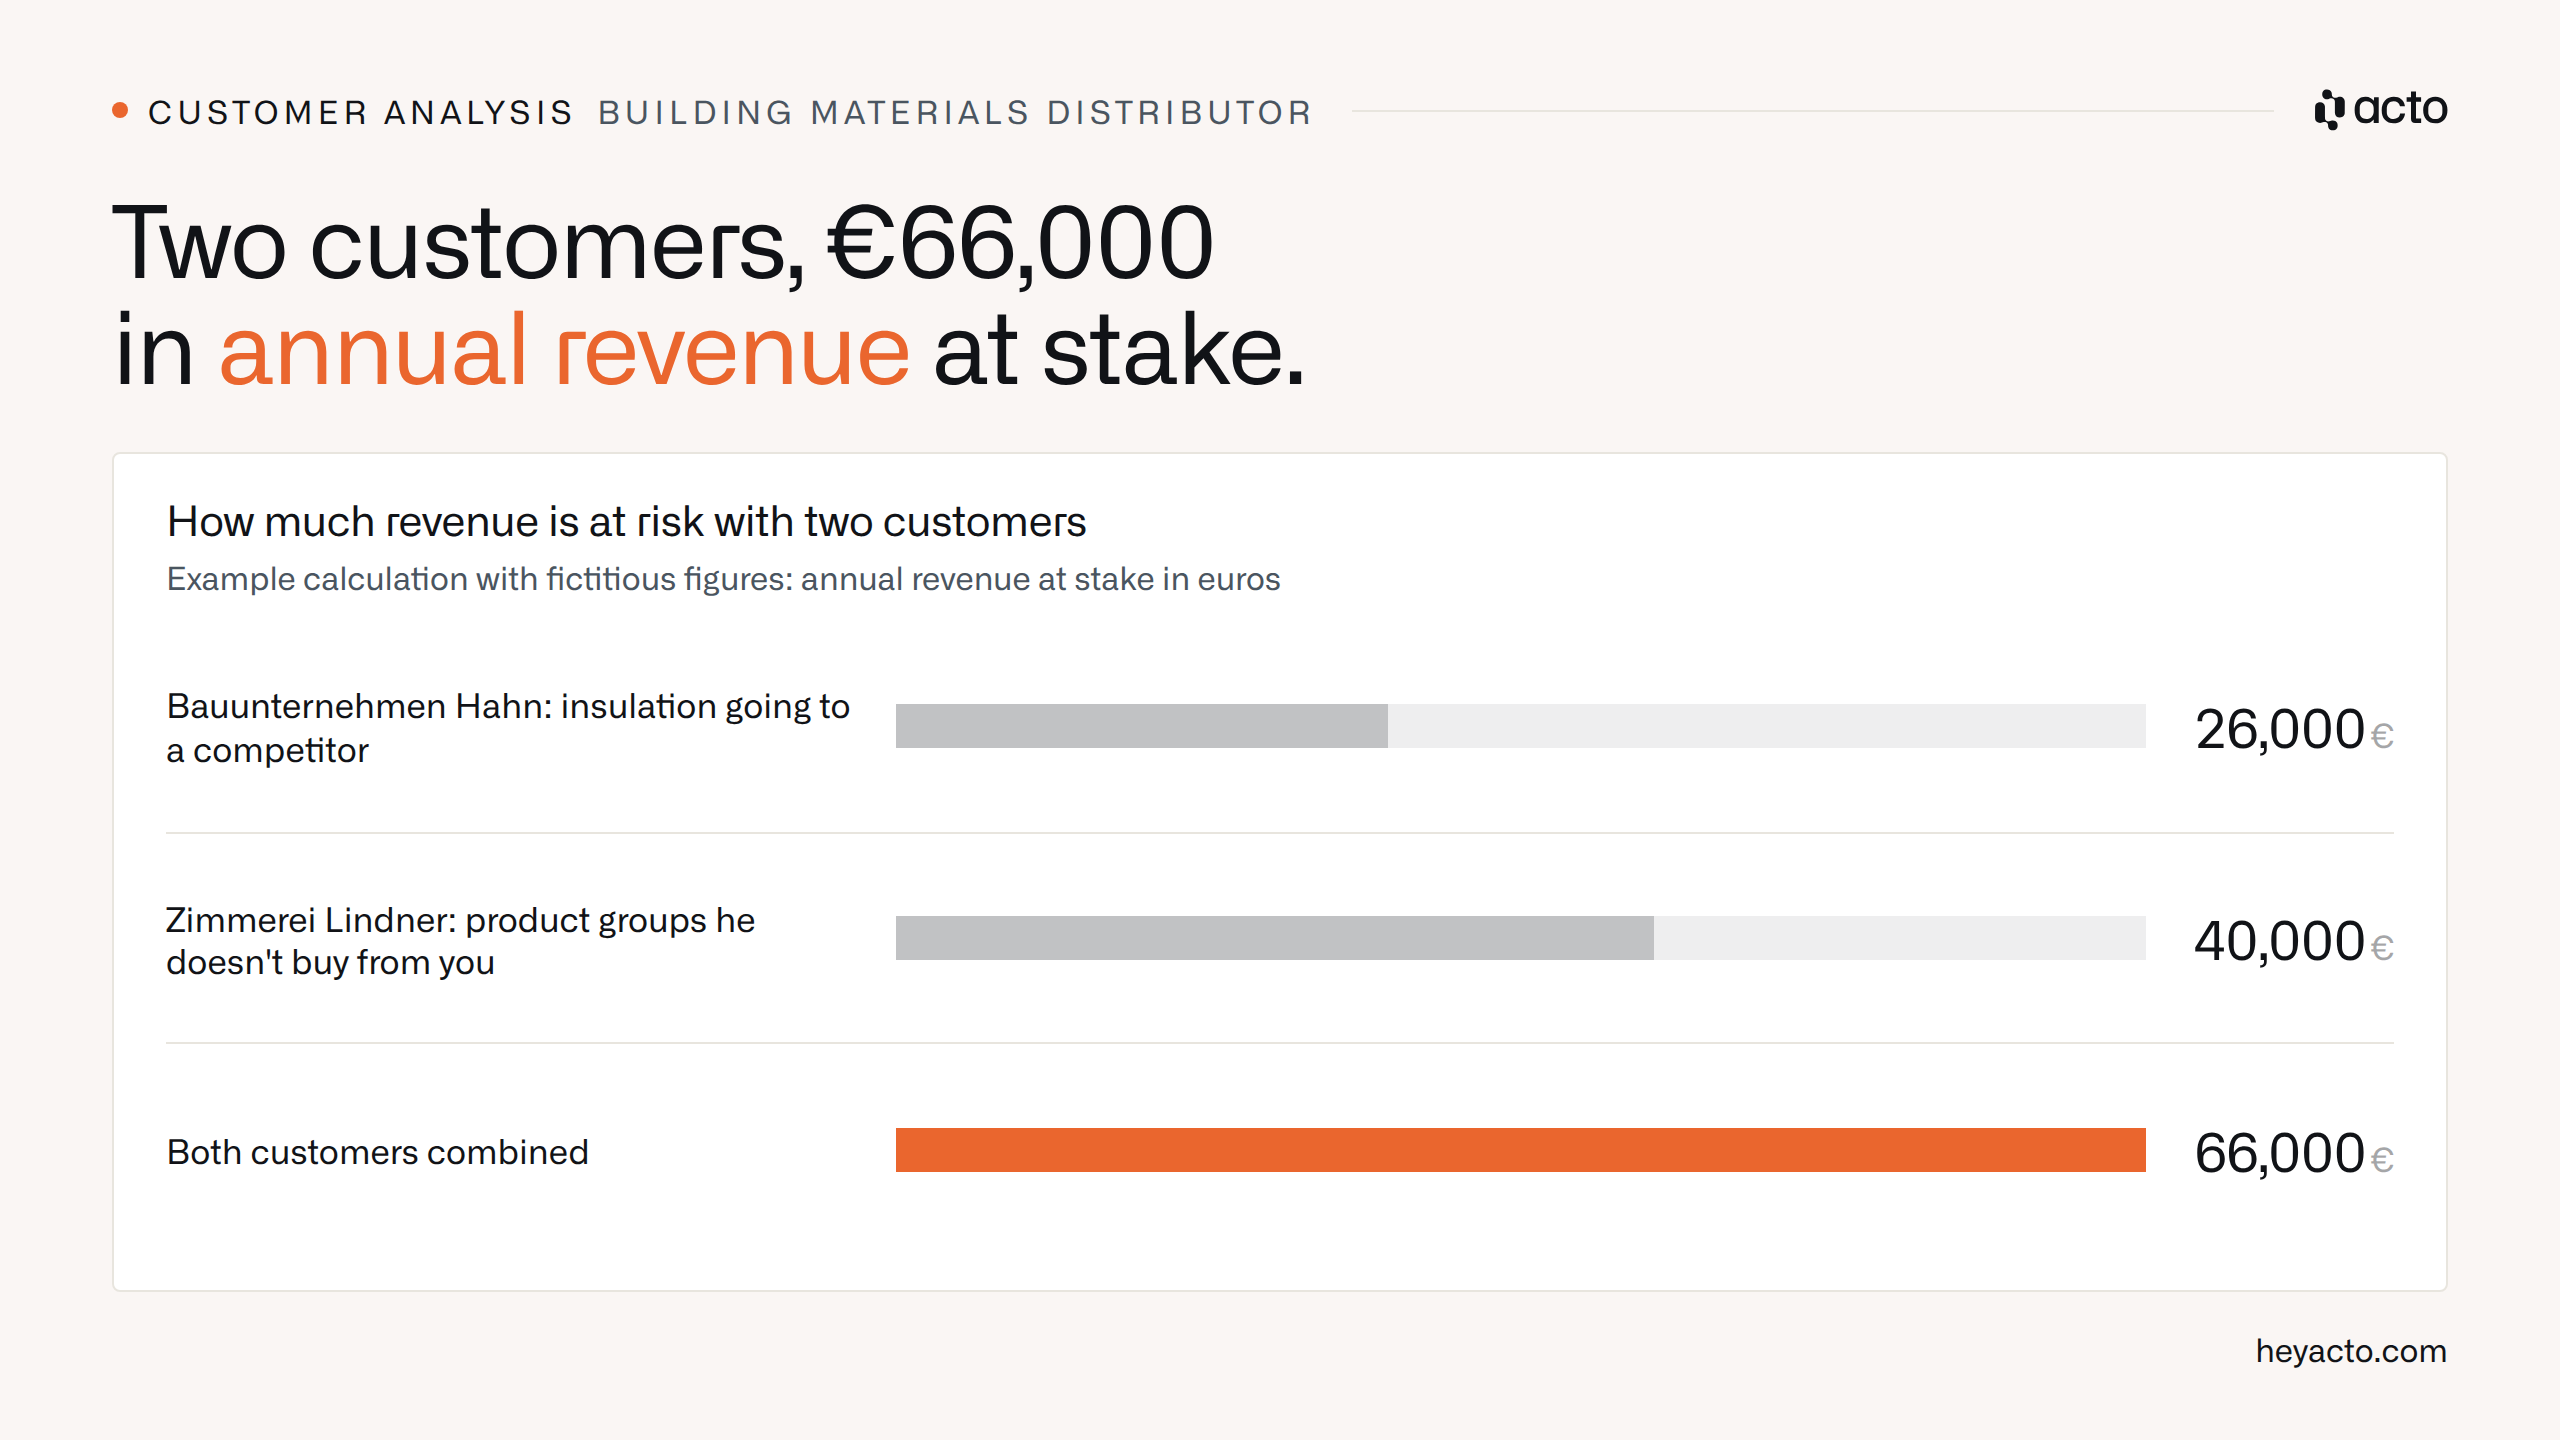
In the example, €26,000 in annual revenue is at stake at Hahn and €40,000 at Lindner, €66,000 combined (fictional figures).
How do you turn the analysis into a visit and call list?
You turn the analysis into a list by assigning every signal to a specific customer contact and re-sorting the list every week. Each entry includes:
- the customer
- the channel
- the person responsible
- the talking point
The logic behind it is a simple formula: revenue = revenue per visit × number of visits.
Every sales initiative has to move one of these two levers. Customer analysis moves the first: the right customers, the right topics, more revenue per visit. Less admin and faster preparation move the second, because they free up time for conversations. With field reps in wholesale making around six visits a day, according to our study, the choice of customers determines the week's revenue.
Fixed visit cycles every four, eight or twelve weeks follow the calendar. A fixed cycle is like filling up your car by the date rather than the fuel gauge. On that cycle, the rep visits Krause because the appointment is due and overlooks Lindner because he never had one.
Here's how to build the list each week:
- Collect signals: every customer with an overdue reorder, a product group dropping off, a range gap or a jump in orders.
- Sort by revenue impact: start with whatever costs or brings the most revenue, even if another customer hasn't been visited for longer.
- Assign a channel: a visit for conversations that need advice, a call for reorders and quick clarifications.
- Note the reason and topic: one sentence on why this customer is up and what to discuss.
- Record the feedback: what came out of the conversation, so the next list gets better.
Proactive inside sales gets the same list for its calls. That way, they call the tiler about the tile adhesive instead of waiting for the order to come in on its own, or not at all. The analysis decides whom your team visits; route planning for field sales works out the best way to get there.

What should you use: Excel, a BI dashboard, an in-house build or specialist software?
The right option depends on how often the analysis needs to run and for whom: Excel is enough for a one-off ABC analysis, a business intelligence (BI) dashboard helps sales leadership with management, and daily prioritization in everyday sales work needs specialist software. An in-house build only makes sense for companies with a strong data team of their own.
| Option | Strength | Limitation | Makes sense if |
|---|---|---|---|
| Excel list from ERP export | Quick to start, no cost for new software | Manual, depends on individuals, quickly outdated | you do an ABC classification once a quarter |
| BI dashboard | KPIs for sales leadership at a glance | Field reps have to dig out the information themselves | leadership manages and the team doesn't need to use it daily |
| In-house build | Full control over logic and data | Ties up IT capacity, maintenance, hard-to-predict costs, demanding algorithms for range gaps | you have your own data team and no ERP or CRM project underway |
| Specialist sales AI software for wholesale | Ready-made recommendations per customer with reasons, updated daily | Only pays off with many customers and repeat orders, little value in pure project business | hundreds of customers per rep need to be prioritized |
Most companies start with Excel, and many get stuck there, because the list is already out of date by the next export.
"When deciding which customers to prioritize, we made do with homemade Excel lists. But they weren't just cumbersome; they were often already outdated by the time we used them."
– Marco Bender, Head of Inside Sales, Plate
A BI dashboard solves the freshness problem but shifts the work: someone has to open it, filter it and interpret it. People who spend all day in the car rarely do. They don't need another dashboard; they need the ready-made answer to which customer is up today.
What a solution for daily customer analysis in wholesale needs to do:
- Read ERP data: order lines, product groups and customer master data directly, with nobody maintaining lists.
- Prioritize per customer: who's up, with a reason and a talking point, compared against their own pattern and against similar customers.
- Show up in daily work: in Outlook, the CRM or an app, so nobody has to open yet another system.
- Factor in context: include visit reports and feedback so a company holiday doesn't trigger an alarm.
- Run without upkeep: recalculate daily without the sales team having to backfill data.
How does Acto bring customer analysis into everyday sales work?
Acto takes over the daily analysis nobody has time for: every night we read your ERP order data, and every morning we show field and inside sales which customer is up and why. Our AI software for field sales covers these steps:
- Prioritize: churn risks, overdue reorders and range gaps per customer, with reasons
- Prepare: risks, potential and customer history at a glance
- Deliver: in Outlook, the CRM or the app
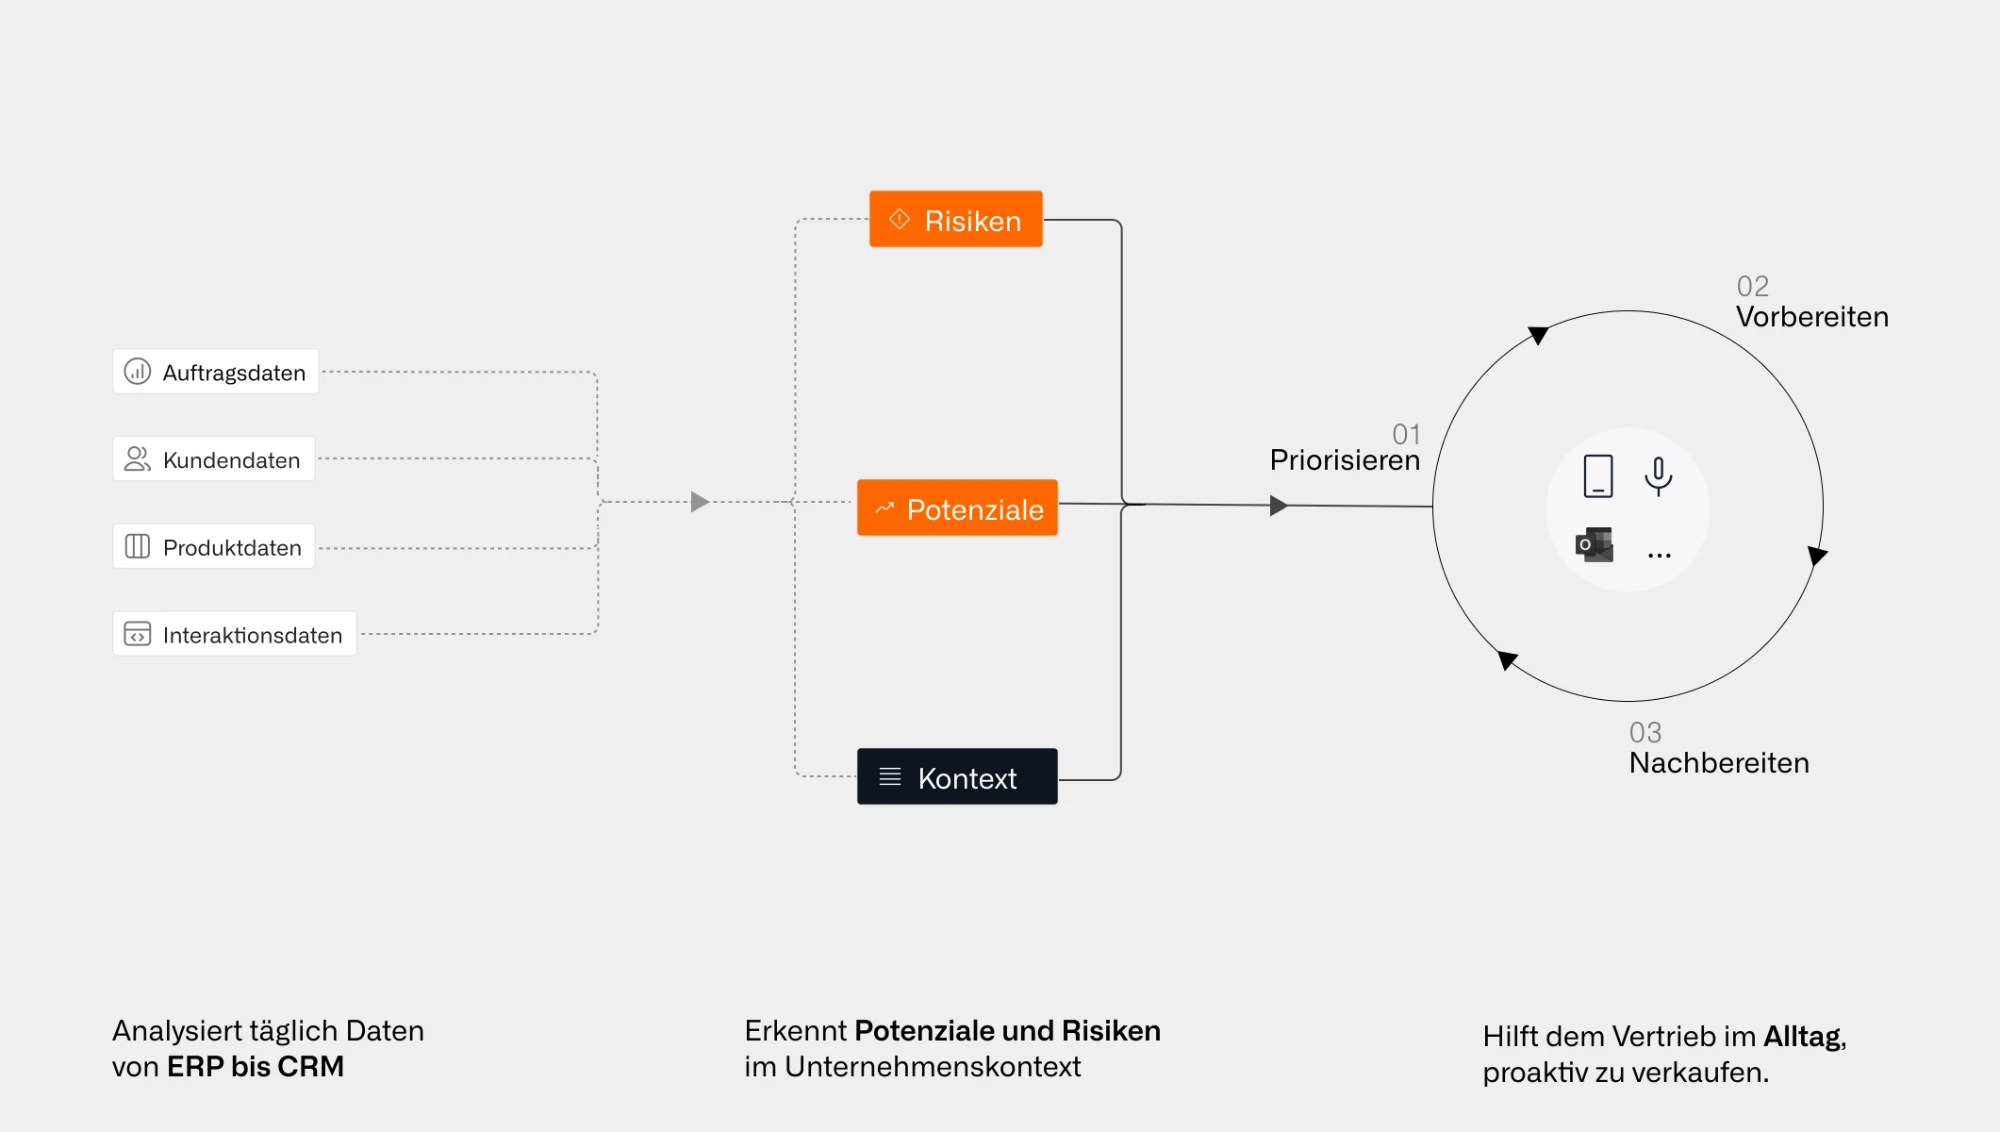
Order, customer, product and interaction data become prompts for prioritizing, preparing and following up.
At Plate, revenue among users in the pilot team rose by 10%, and customers contacted after an Acto notification bought 2.1 more products on average.
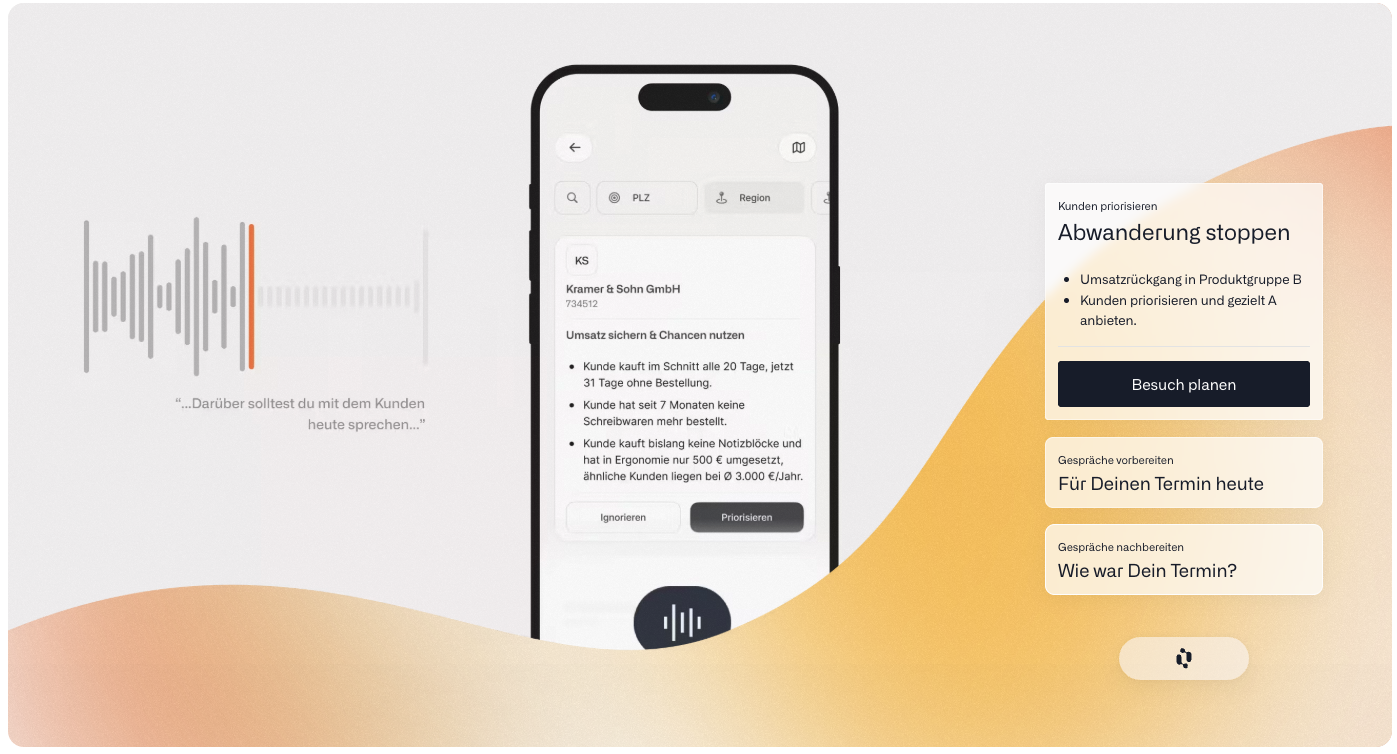
Acto app with demo data: customer card for sample customer Kramer & Sohn GmbH with three buying-pattern prompts and the actions "Ignore" and "Prioritize".
This week, pull the customers from your ERP whose current order gap is well beyond their usual rhythm, and count how many of them aren't in any visit or call plan.
In a call, we'll show you which buying signals are hidden in your ERP data and which customers your sales team should contact this week.